Discover Balance between Luck and Skill: Calculating T-Statistic
Subscribe
The t-statistic helps calculate whether a trader is achieving their results from pure luck / randomness OR whether a sustainable approach is behind the success (source: Blue Owl Press).
This is VERY important as it provides a key understanding whether:
a) the trading system is expected to be profitable in the long run;
b) traders are handling their risk management properly and;
c) we are progressing as a trader, or in other words are we using less luck and more skills when achieving success.
The very first time I talked about the t-statistic was in an article with Admiral Markets and I want to share it with the Elite CurrenSea (ECS) followers (by the way, check out the great Admiral Market’s MT 4 supreme addition with an extra 50+ plug-ins).

The t-statistic basically indicates how much range or distribution is around your average result.
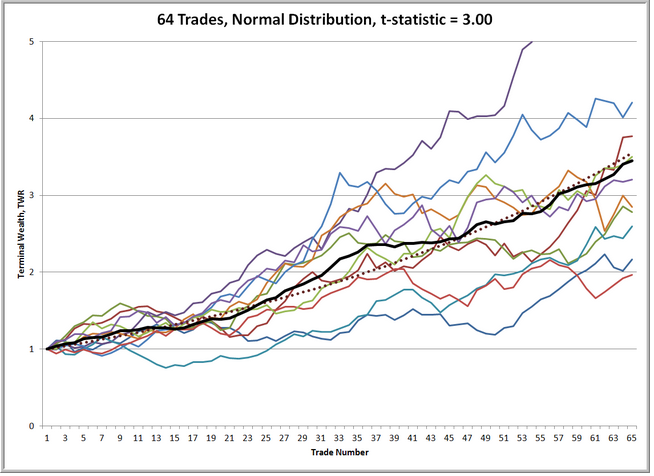
1) When the variance is wide then there is high(er) chance that the result was pure luck (below; 1st image).
2) However, if the variance is small then there is a higher chance that traders will see a similar repeat of previous results in the future (below; 2nd image).
A higher t-statistic indicates low levels of variance and hence increases the level of confidence. A lower t-statistic indiactes high levels of variance and thus decreases the level of confidence. The lower variance and higher t-statistic is better for you as a trader and is a critical aspect of a trader’s consistency.
A t-statistic above 2.0 is considered long-term viable / sustainable. A t-statistic below 1.0-1.5 is bad and a t-statistic of 1.5-2.0 still needs to prove itself. A t-statistic of 3, 4, 5 etc is obviously even better than 2.
 (source: Blue Owl Press)
Here are the step by step instructions to calculate the t-statistic yourself:
Step 1) Choose a group of weeks, months or bunch of trades you want to analyze. It’s good to have a sample size of minimum 30 trades. Take the % result of each setup and then count the total of all the setups.
Step 2) Divide the total by number of trades to get average result per trade.
Step 3) Take the % result of each setup and substract the average (point 2) per trade.
Step 4) Multiply the result of point 3 of each row by/times point 3
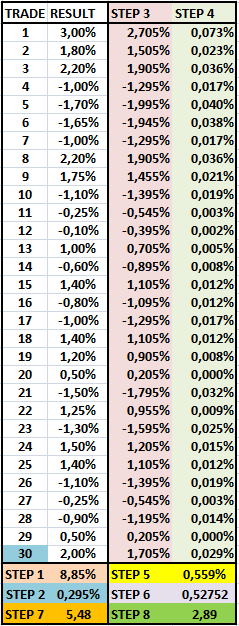
Step 5) Count the total of point 4 for all rows.
Step 6) Divide the average result per trade (point 1) by point 5
Step 7) Square root of the number of trades
Step 8) Multiply point 7 by point 6 = t-statistic
Thank you for reading AND join our webinar list for a special 5 week course on Forex trading for FREE starting mid August (1 a week) by sending an email to [email protected]
Or receive a copy of the excel sheet calculation via the same email address.


Leave a Reply