Fibonacci, Market Structure, and Candles (part 10)
Subscribe
The series on Fibonacci has discussed various methods of how to place the Fib tool on the chart such as using targets for Fib placements, building on an oscillator and utilizing the Fractal indicator.
There is one more simple way of determining the Fibonacci levels: applying the Fib tool on the candle itself.
THE HIERARCY OF PRICE AND FIBBING
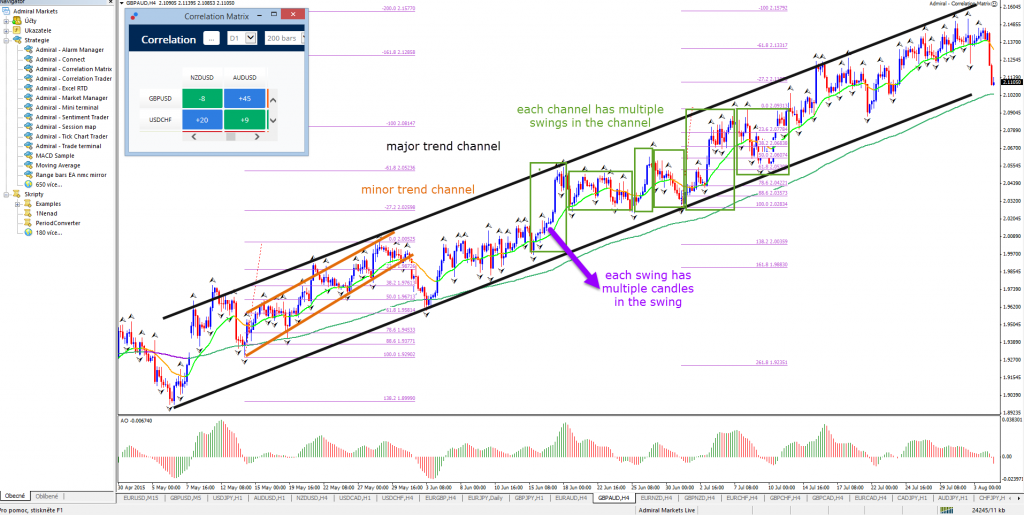
The Forex market encounters ups and downs on all levels from the very lowest to very highest time frames. These retracements occur on various scales such as:
1) Within trends – price action which fits in trend channels;
2) Within swings – price action which makes up the legs of the trend;
3) Within candles – price action which builds sub parts of the swing.
All 3 previous posts (targets, AO, Fractal) have primarily discussed how to place the Fib tool on swings. Today our focus is on placing Fibs on the candles themselves whereas next week we discuss placing the Fibs on trend channels.

LET IT CENTER BEFORE YOU ENTER
The market’s nature is to retrace almost each and every part of the chart with the occasional exception during moments of (strong) momentum. Grab a chart and analyze it closely. You will probably notice that most candles are at least partially retraced. From that point of view it makes sense to wait for a retracement first before entering.
An easy way of remembering that is: let it center before you enter!
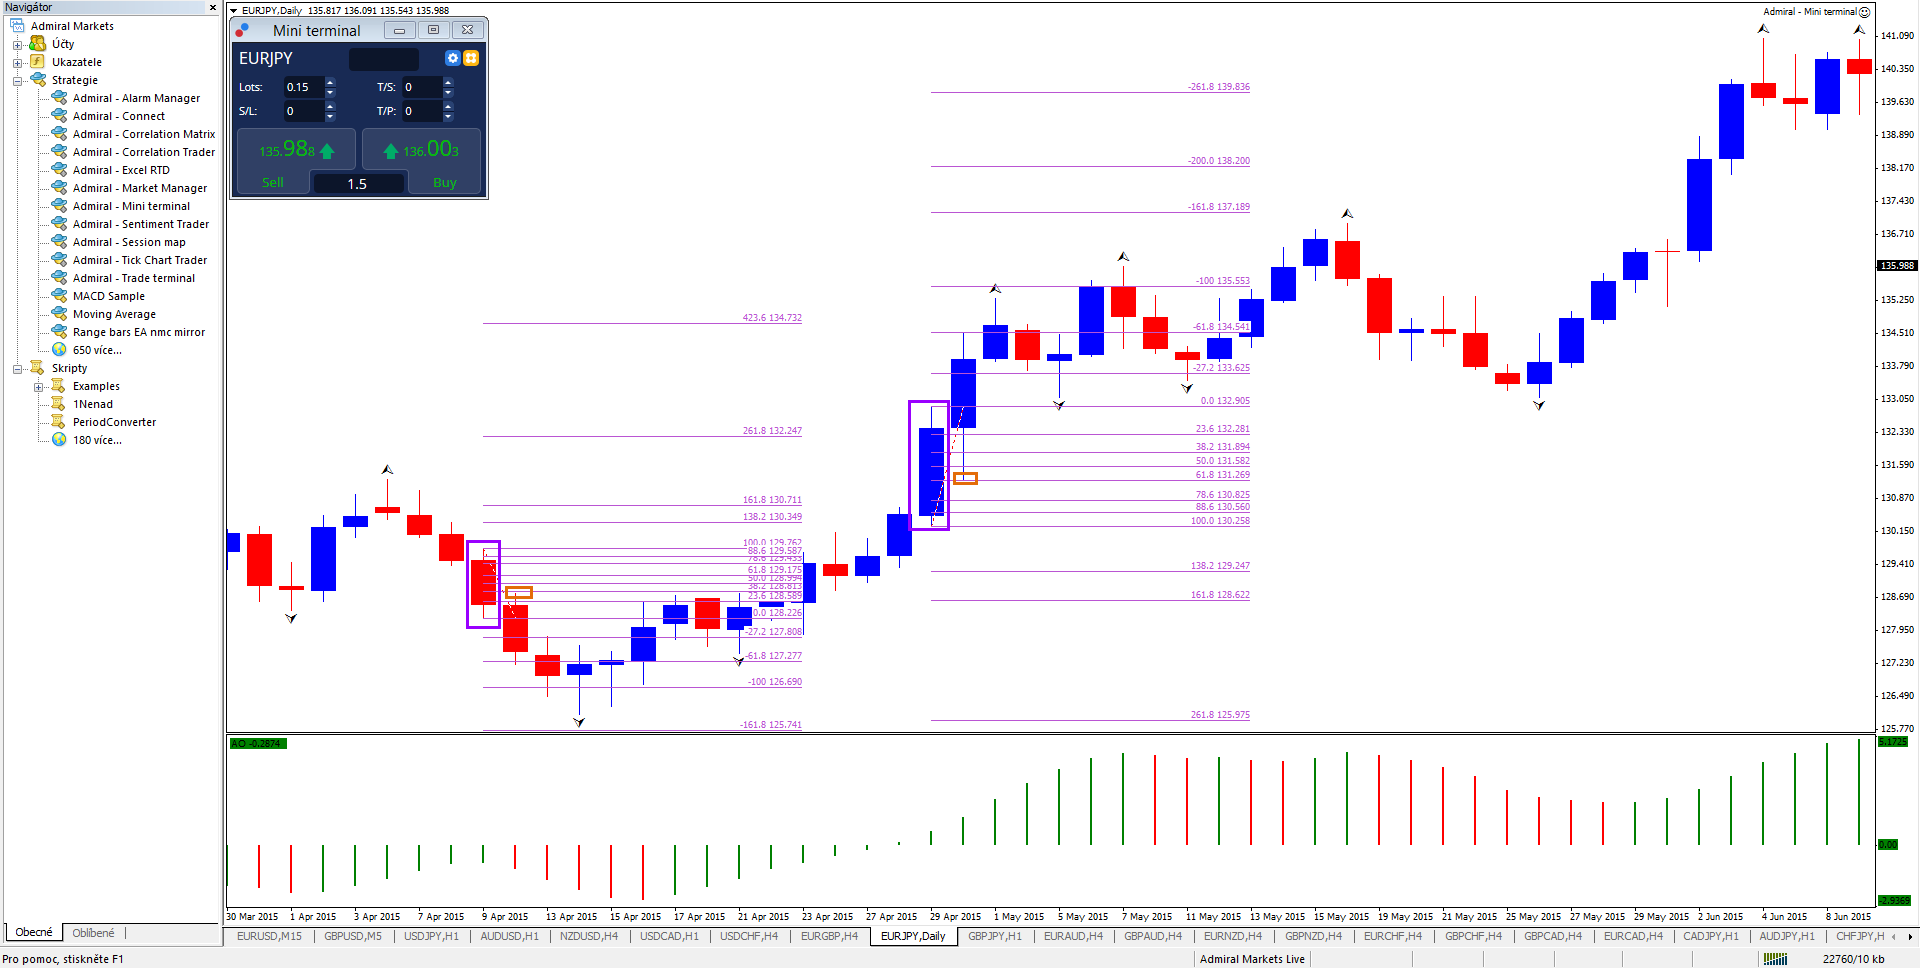
PROCESS OF FIBBING THE CANDLE
Placing a Fibonacci tool on the candle is very simple:
1a) If the previous candles were bearish, place the Fib on the nearest candle high to candle low.
1b) If the previous candles were bullish, place the Fib on the nearest candle low to candle high.
2) I personally do not consider a candle retraced if price does not pullback to at least the 38.2% of the candle so I typically wait for at least a retracement to 38.2% or 50% Fib of the candle before entering.
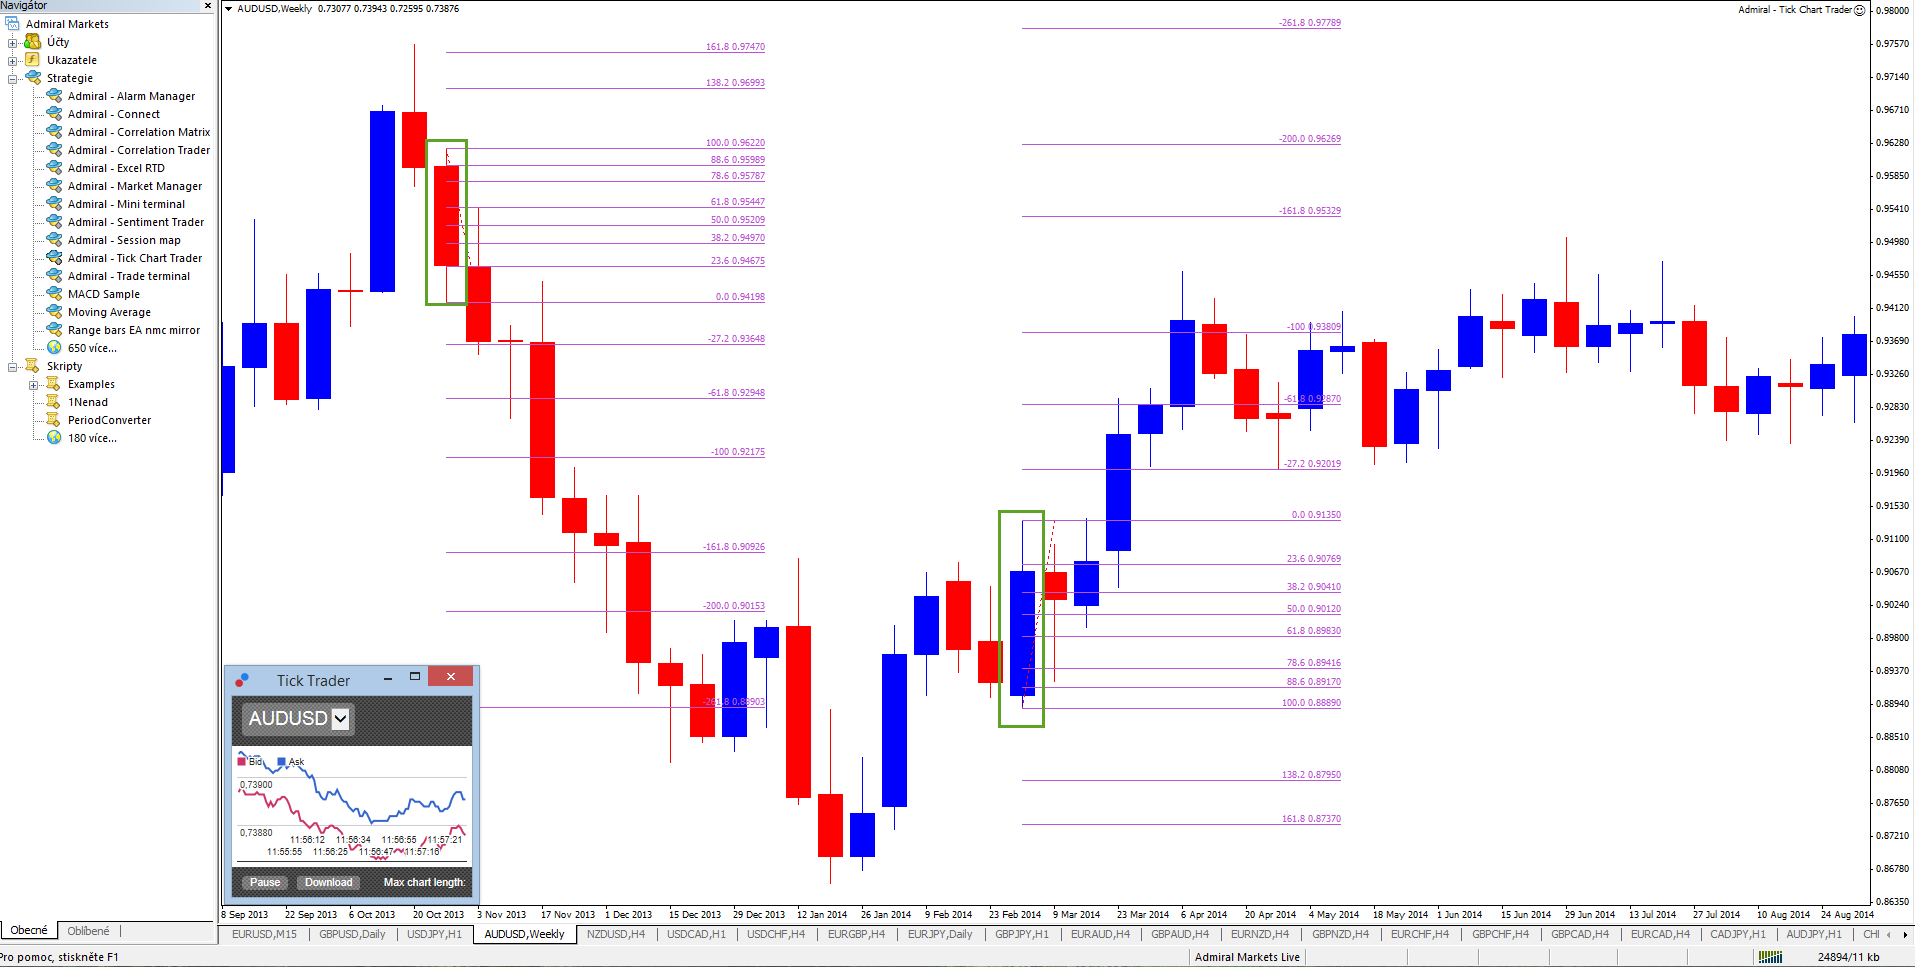
3) In some cases the stop loss can be placed below the candle low or above the candle high. This is especially true when using a daily or weekly time frame.
The technique is simple and capitalizes on the natural low and high tides of the Forex market. Of course proper analysis has to be completed before applying the concept to the charts as the method indicates how a trader can enter, not whether the entry is statistically viable.
The idea can certainly be combined on multiple time frames. For instance a strong weekly bullish candle could get a 50% retracement which could signal a potential for long. A trader then zooms into a 4 hour chart and sees a bullish candle at the 50% Fib. The trader takes an entry order at the 38.2% Fib of the 4 hour candle (either via pending or market depending on where price is).
Before leaving, make sure to read our entire Fibonacci series!
Good trading!


Leave a Reply