? ETH/USD Tests 21ema Resistance after 88.6% Fib Bounce ?
Subscribe

Ethereum (ETH/USD) made a bullish bounce as expected at the 88.6% Fibonacci level, which is a key level we mentioned in our analysis last week.
ETH/USD
Daily
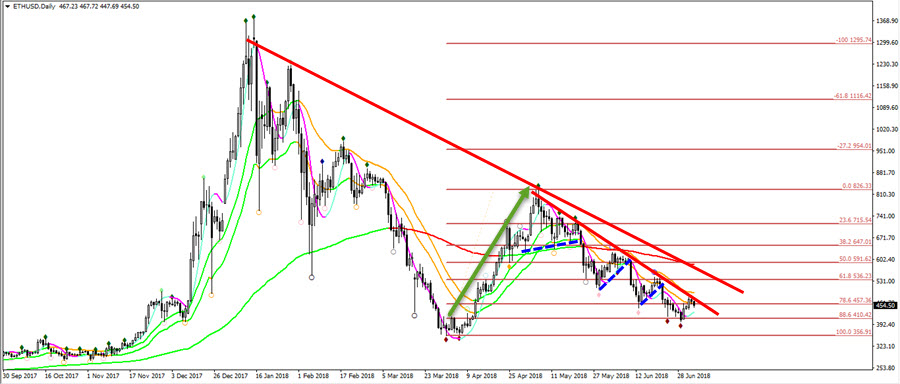
ETH/USD however is still facing a strong resistance zone due to the trend line and 21 ema zone. Price must break above these resistance levels before any serious uptrend is in question. Otherwise the downtrend is still in play and a bearish breakout below the 88.6% Fib and bottom could send the pair down lower.
Daily 2
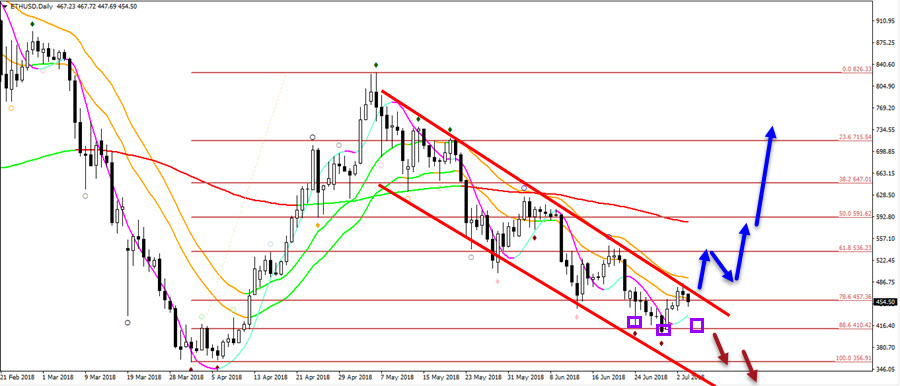
ETH/USD could use the potential head and shoulders pattern for a bullish reversal. A bearish break below the purple box could send the pair lower whereas a break above the 21 ema, pullback and continuation could indicate a larger bullish movement. For the moment, price is challenging a key resistance trend line.
Good trading,
Chris Svorcik
Elite CurrenSea


Leave a Reply