? XRP/USD Expects Breakout after Arriving at Key S&R Zone ?
Subscribe
Hi traders,
Ripples (XRP/USD) showed a bullish correction towards the 38.2% Fibonacci retracement level after completing a reversal chart pattern last week as expected. This could indicate the end of a wave 4. Price is now testing a key support and resistance zone for either a bullish or bearish breakout.
XRP/USD
4 hour
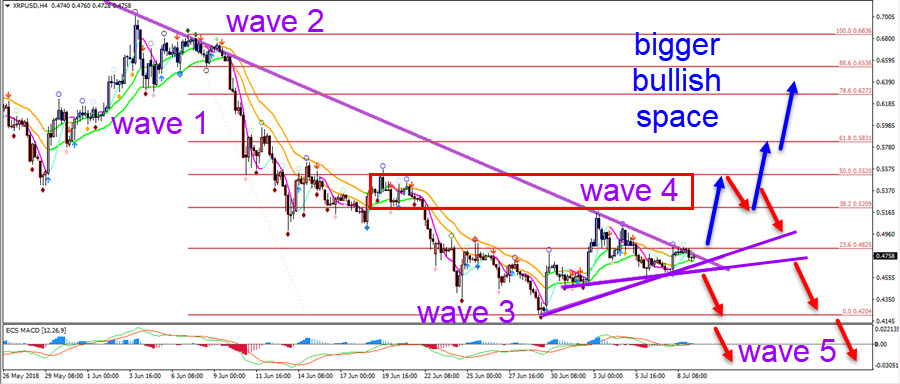
XRP/USD is in a triangle. A bearish breakout could confirm the end of wave 4 and start of wave 5 whereas a bullish breakout could see price move towards the 50% Fibonacci level. A break above the 50% makes a bullish wave analysis more likely.
1 hour
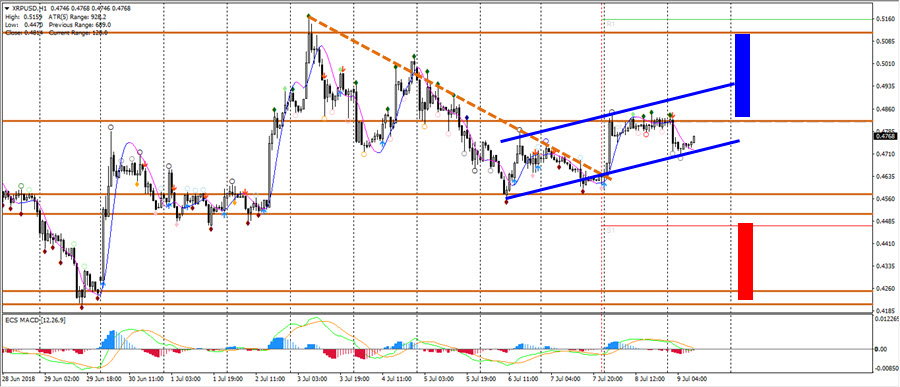
XRP/USD is showing a bullish channel, which makes a bullish breakout perhaps a bit more likely. That said, both support and resistance zones play a key role for the next breakout.
SWAT chart

This is the XRP/USD chart while using the SWAT software. As you can see, price is showing strong bearish momentum when red candles are visible. The key question is now: what SWAT candle will arrive at this point? A blue 4 hour candle could indicate a higher chance of upside whereas a red candle shows potential for more downside.
Good trading,
Chris Svorcik
Elite CurrenSea


Leave a Reply