Elliott Wave Fibonacci Relationships & Patterns Core Reference Guide
Subscribe
The Elliott Wave Theory is used to understand the flow of price action and the market psychology. Elliott Wave attempts to identify recurring price movements within financial markets. These repetitive price movements are the result of a natural rhythm of crowd psychology that exists in all markets. The Elliott Wave rules and guidelines help recognize a price swing and the correct waves. It also used to classify them into a set of meaningful patterns, which can become a reliable tool for future price predictions. The underlying principle is that price-action unfolds via an endless alternation between trending (impulsive, motive, or momentum) and corrective (correction) cycles, while producing this effect on any relative timescale (Fractal).
Understanding Impulsive and Corrective Waves
We need to review some basics around price movement before moving into the exact mechanics of the Elliott Wave Theory. Each price chart has three basic types of price action phases. Elliott Wave (EW) price patterns are divided into: impulsive, corrective, and consolidation.
Impulsive waves (momentum/motive waves)
An impulsive wave is price movement that initiates progress in one direction, which is called the trend. Price usually moves more distance (in pips) and quicker (less time) when trending. This makes trending moves more appealing for trade setups. The waves are split into 5 impulsive waves with the trend and 3 corrective waves against the trend (see below).
Corrective waves (correction)
Corrective waves are against the trend (price movements that are reactionary in relation to the previous trend-setting move). They essentially attempt to revert or undo the movement that was initiated by the preceding motive wave. Price usually moves less distance (in pips) and slower (more time), although fast corrections can occur as well (zigzags). This makes corrective moves less appealing for trade setups. If the trend is bullish, then the correction of the trend would be bearish. If the trend is bearish, then the correction of the trend would be bullish.
Price Consolidation
No trend is visible. Price is often in a range and makes more erratic movements.
Now it’s time that we dive into the details of this Elliott Wave theory and understand how to effectively trade using this technique. Ralph Elliott discovered a very important pattern in the markets in the early 20th century. His Elliott Wave Theory will now be explained in the following guide.
Main Elliott Wave Rules
The Elliott Wave Principle has three core rules. Your wave analysis must match these Elliott Wave rules, otherwise the wave count is incorrect. Here is an overview of the three Elliott Wave rules:
1. Wave 2 never retraces more than 100% of wave 1.
2. Wave 3 cannot be the shortest of the three impulse waves, namely waves 1, 3, and 5.
3. Wave 4 does not overlap with the price territory of wave 1, except in the rare case of a diagonal triangle formation.
The Elliott Wave Theory also has many guidelines per wave pattern. This guide will explain all of the sub rules and guidelines for each and every wave. These sub rules and guidelines are extra information though. There are only 3 main Elliott Wave rules which always remain valid (see above) for each wave count and analysis.
How to Use This Guide
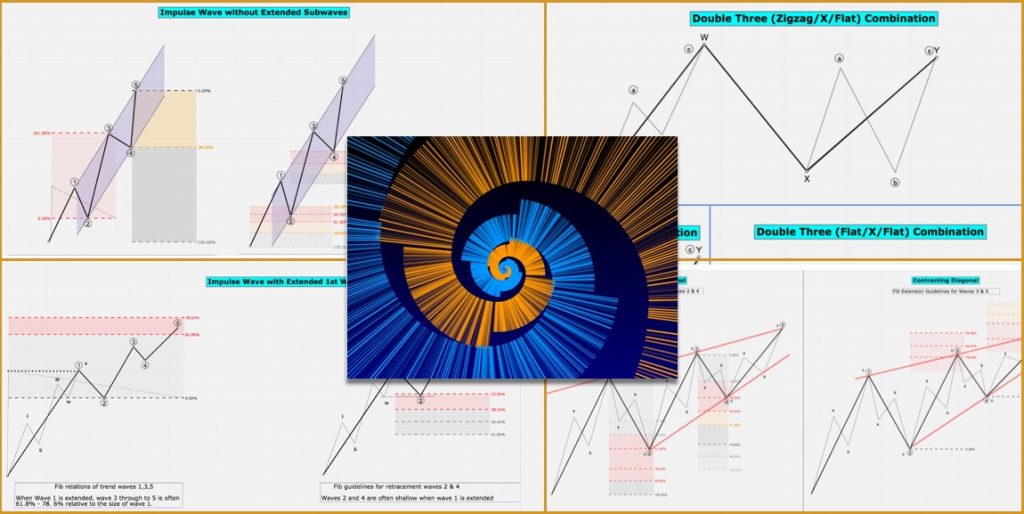
This EW reference guide provides an idealized drawing for each EW pattern, including a visualization of the most important internal wave size relationships. It also includes an overview of the Elliott Wave rules. The images highlight the most common Elliott wave retracement levels and extension targets in red, followed by the next most common targets in orange, followed by the least common targets in grey.
Motive Wave: IMPULSE
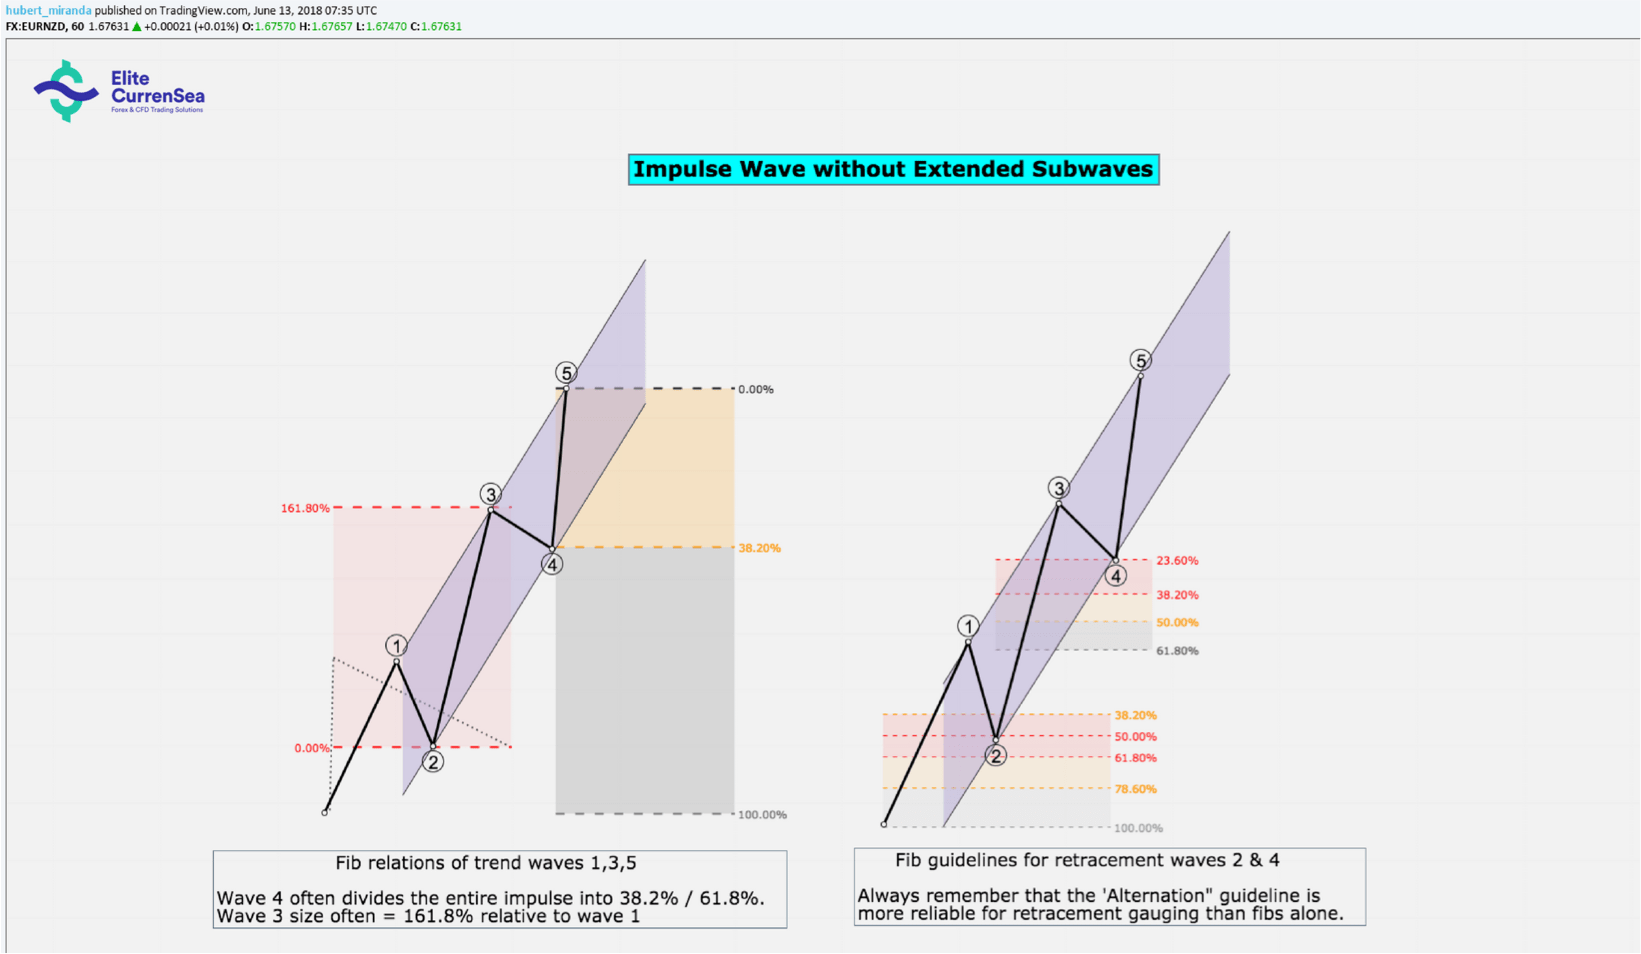
Note: The percentages in the above for Fibonacci extension targets are drawn from the start of the wave, but the ratios are based on the size of the preceding motive wave (i.e. targets of 3 are relative to the size of wave 1, targets of wave 5 are relative to the size of wave 3.
Rules:
- An impulse consists of 5 internal waves.
- Wave 1 and 5 always have to be impulses or diagonals
- Wave 3 always has to be an impulse by itself (i.e. can’t be a diagonal)
- Wave 3 must never be the shortest (in terms of percentage gain/loss) within the sequence
- Wave 2 is always a corrective pattern and must not retrace more than 100% of wave 1
- Wave 2 can be any corrective pattern except a triangle (but it can be a complex combination (wxy or wxyz) that ends with a triangle)
- Wave 4 must not enter the price territory of wave 1
- Wave 4 must always be a corrective pattern (any)
Guidelines:
- Waves 2 and 4 tend to create alternation between each other (as outlined in the introduction of this guide)
- Wave 2 usually retraces to deeper levels of wave 1 than wave 4 does relative to wave 3
- Wave 2 develops more commonly as a simple corrective pattern (i.e. zigzag or double/triple zigzag)
- Wave 4 develops more commonly as a complex corrective pattern (i.e. triangle, double/triple threes, flat)
- In almost all impulses, one of the action waves (1,3, or 5) becomes extended, and it is most commonly wave 3
- Extended waves can contain several further extensions within them
- Wave 5 can fail to go beyond wave 3 (truncation) but it is not very common. It usually happens when wave 3 has been exceptionally long and overstretched. Truncation often results in significant reversals.
- Wave 5 is most likely not going to form a diagonal if wave 3 is not extended
- An impulse is not over until all sub degrees are finished (e.g. 5 of 5 of 5). The wave count takes precedence over channel lines and Fibonacci targets
- Wave 3 almost always exhibits the greatest volume. If volume during the 5th wave is as high as the 3rd, expect an extended 5th wave.
Elliott Wave Fibonacci Retracement and Extension Guidelines:
- If wave 1 is extended, then the size of wave 3 through to the end of wave 5 is often 61.8% – 78.6% relative to the size of wave 1
- If wave 1 is extended, then wave 2 and 4 are very likely to be shallow (i.e. 23.6% – 38.2%)
- If wave 1 is extended, then wave 2 will often end at the level of sub-wave 4 of 1 (i.e. the internal wave 4 of wave 1)
- If wave 2 retraces more than 78.6% of wave 1, the idea that it really is a wave 2 becomes more doubtful (possible A-B?)
- If wave 3 is extended, then wave 1 and 5 are often nearly equal in magnitude and duration. If equality is lacking, a 61.8% relationship is next most likely.
- If wave 3 is extended, then wave 4 often ends at the level of sub-wave 4 of 3 and is quite shallow (retraces 23.6% – 38.2% of wave 3)
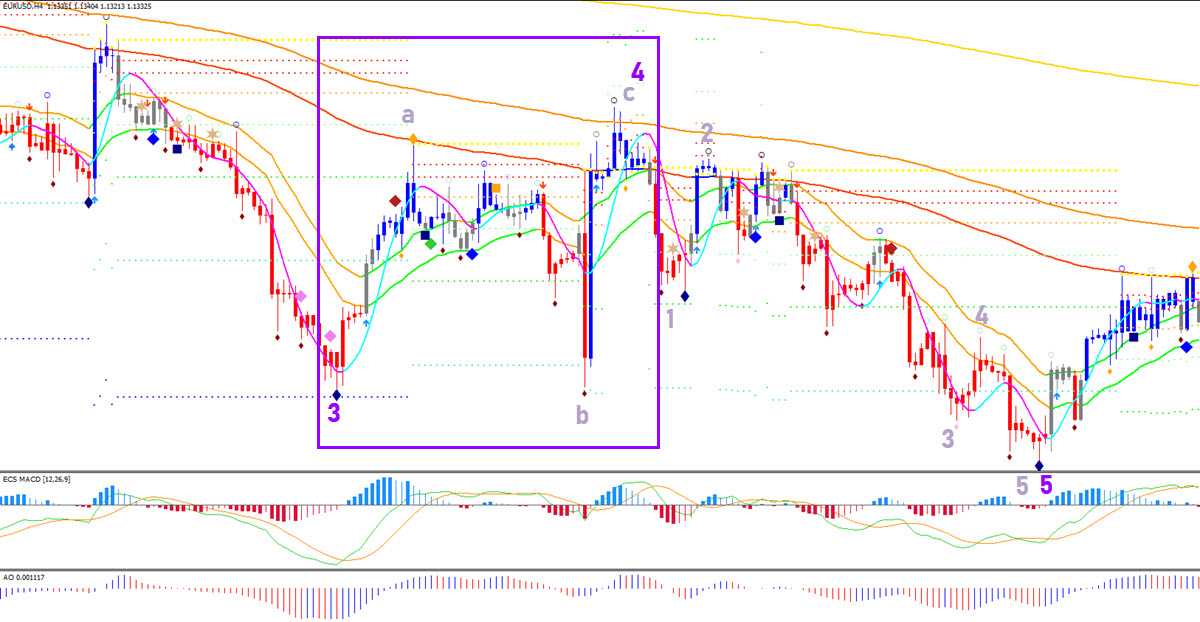
- If wave 3 is extended and very vertical, it will likely overshoot the trend channel that can be drawn when placing the anchor points at the extremities of wave 1, 2 and 4. However the channel is still very valid for gauging the end of wave 5 (see image)
- If wave 4 retraces more than 50% of wave 3, it is quite often not a wave 4.
- Wave 5 is likely to become extended if wave 1 and 3 are equal in size.
- If wave 5 is extended, then it often finishes at the 161.8% extension relative to the magnitude of wave 1 through to 3 (see image)
- If wave 5 is extended, then the ensuing correction is often sharp and swift and ends near the extreme of sub-wave 2 of the extension. This does not apply when the market is ending a 5th wave simultaneously at more than one degree.
Motive Wave: DIAGONAL

Note: The percentages in the above for Fibonacci extension targets are drawn from the start of the wave, but the ratios are based on the size of the preceding motive wave (i.e. targets of 3 are relative to the size of wave 1, targets of wave 5 are relative to the size of wave 3.
Note: The percentages in the above for Fibonacci extension targets are drawn from the start of the wave, but the ratios are based on the size of the preceding motive wave (i.e. targets of 3 are relative to the size of wave 1, targets of wave 5 are relative to the size of wave 3.
Rules:
- All diagonals consist of 5 waves
- Diagonals can be ‘leading’ or ‘ending’ diagonals, depending on whether they form at the start or end of a trend. Diagonals therefore can only form in the positions of wave 1 (leading) or 5 (ending) of an impulse, or the positions of wave A (leading) or C (ending) of a zigzag.
- Within an ending diagonal, all 5 waves must be zigzags (simple-, double-, and triple-zigzags are all valid)
- Within a leading diagonal, at least waves 2 and 4 must be zigzags (simple-, double-, and triple-zigzags are all valid). Waves 1, 3 and 5 can be impulses or zigzags. (If 1, 3, and 5 are impulses, be aware that it could easily be a 1-2, 1-2, 1-2 sequence instead of a diagonal)
- Wave 2 must not retrace more than 100% of wave 1
- Wave 4 must overlap with wave 1(please note that opinions differ over this rule. There are some Elliott Wave researchers who believe that ending and leading diagonals can be valid without wave 4 needing to move into territory of wave 1, although they still consider it unusual)
- Wave 4 never moves beyond the end of wave 2
- Leading and expanding diagonals must not have a truncated 5th wave.
- Contracting diagonals always have a shorter wave 3 than wave 1 (in terms of percentage gain/loss)
- Contracting diagonals always have a shorter wave 5 than wave 3 (in terms of percentage gain/loss)
- Contracting diagonals always have a shorter wave 4 than wave 2 (in terms of percentage gain/loss)
- Expanding diagonals always have a longer wave 3 than wave 1 (in terms of percentage gain/loss)
- Expanding diagonals always have a longer wave 5 than wave 3 (in terms of percentage gain/loss)
- Expanding diagonals always have a longer wave 4 than wave 2 (in terms of percentage gain/loss)
Guidelines:
- Contracting diagonals form within two converging trend lines (contracting wedge)
- Contracting diagonals can overshoot its trend line during wave 5 (called throw-over) and still be valid as long as wave 5 remains smaller than wave 3
- Contracting ending diagonals can also undershoot its trend line during wave 5 (truncation).
- Contracting ending diagonals should always show a corresponding decrease in momentum as they progress towards their culmination. Many small candles that take a lot of time to gain further ground is a good sign that an ending diagonal is indeed occurring. Conversely, strong big candles within a potential diagonal formation should be a warning sign that you are probably witnessing a 1-2, 1-2, 1-2 extension of the trend, and therefore not an ending diagonal.
- Expanding diagonals form within two diverging trend lines (expanding wedge). They are more rare than contracting diagonals
- Wave 2 and 4 of any diagonal very often retrace their wave 1 and 3 much deeper when compared to wave 2 and 4 of impulses
- The internal zigzags of any diagonal can sometimes subdivide into more complex double or triple zigzags
- Any diagonal can begin to be confirmed with higher certainty once wave 4 is close to being complete
- Diagonals are more rare in general (although they do occur quite frequently within sub-waves of very small wave degrees that are visible on timescales of M15 and lower)
- If wave 1 is a leading diagonal, wave 3 is usually extended.
- A place to watch out for potential expanding leading diagonals is at the start of stock market declines (due to the opposing forces that are in play during this transitional period). Diagonals occur because of transitory forces of trend changes act against each other
- Ending diagonals are followed by a strong reversal most of the time
Elliott Wave and Fibonacci Retracement with Extension Guidelines: Refer to image for key retracements and extension targets
Corrective Wave: ZIGZAG

Note: The percentages in the above for Fibonacci extension targets are drawn from the start of the wave, but the ratios are based on the size of the preceding wave of the same direction (i.e. targets of C are relative to the size of wave A, targets of wave Y are relative to the size of wave W, targets of wave Z are relative to the size of wave Y.
Rules:
- Zigzags consist of 3 waves (A, B and C)
- Wave A must be an impulse or leading diagonal
- Wave C must be an impulse or ending diagonal
- Only one diagonal is allowed (A or C) per zigzag, i.e. it must have at least one impulse (A or C)
- Wave B can be any corrective pattern (zigzag, flat, triangle, complex combination)
- Wave B must not retrace Wave A by more than 100%
Guidelines:
- Wave C should normally always go beyond A. Wave C can in principle be truncated (i.e. not go beyond wave A) but it is extremely rare.
- Zigzags can become extended into double or triple zigzags, in which case they are labeled wxy (double zigzag) and wxyz (triple zigzag). W, Y, and Z will each subdivide into their own ABC zigzag, while the X wave/s can be any corrective pattern (they take on the same role as B waves in a simple zigzag). Extended zigzags usually form when a simple zigzag appears too small in terms of time and magnitude in order to be proportional to the swing, which it is correcting.
- Zigzags can take many shapes and sizes. One of the features that can help distinguish an A-B-C zigzag from a potential 1-2-3 impulse is that wave A and B will be much more overlapping in general and A waves tend to finish quicker than wave 1 in terms of time and magnitude. Zigzags should often show a very gently sloping channel, whereas 1-2-3 are typically much more steep
Elliott Wave Theory Fibonacci Retracement and Extension Guidelines:
- Waves A and C of a correction tend towards equality (same size 100%). The next most common ratios are C = 161.8% x A or C = 61.8% x A
- Wave B usually retraces between 38% – 79% of wave A
- If wave B is a triangle, there is a higher chance that wave C may only reach the 61.8% extension target.
- If wave B is a running triangle, it will typically only retrace 10 – 40% of wave A
- If wave B is any other sideways correction, it will typically 38% – 50% of wave A
- if wave B is a zigzag, it will typically retrace 50% – 79% of wave A
Corrective Wave: FLAT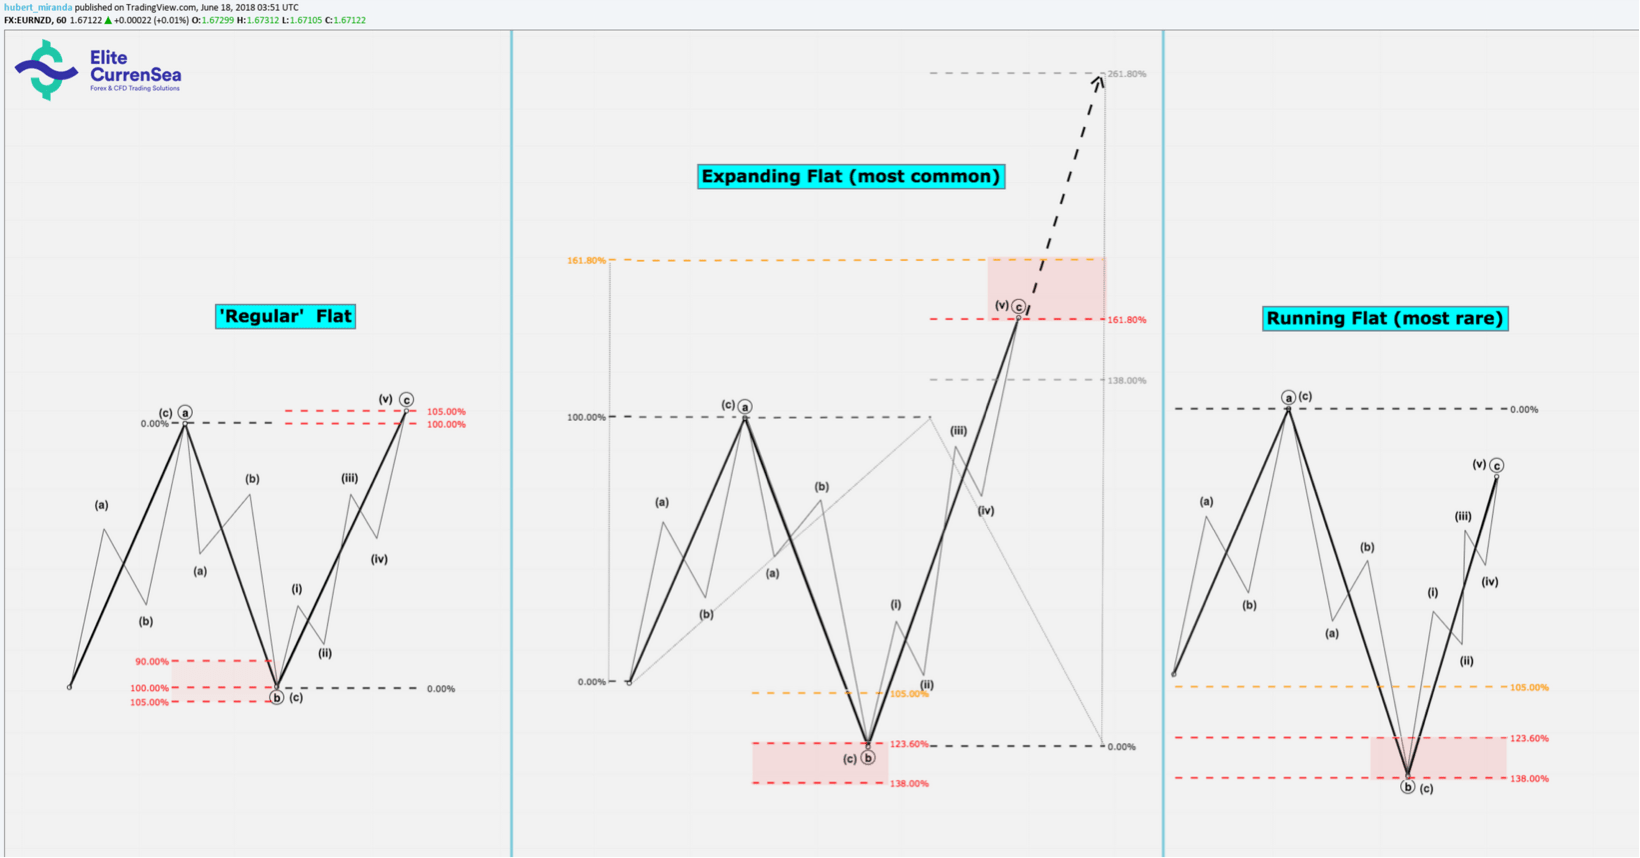
Rules:
- All flats consist of 3 waves (ABC)
- Wave A and B must subdivide into any corrective pattern, but Wave A cannot be a triangle
- Wave C must be a motive wave (i.e impulse or diagonal)
- Wave B must retrace wave A by at least 90%
Guidelines:
- The structure is called an ‘Expanding” Flat if Wave B retraces between 105% – 138% of wave A, and Wave C ends anywhere beyond the end of wave A. Expanding Flats occur most commonly.
- The structure is called a ‘Regular‘ Flat, if wave B retraces between 90 %- 105% of wave A, and the size of wave C is 100% – 105% of wave A. Regular Flats are more rare.
- The structure is called a ‘Running’ Flat if Wave B ends beyond the start of wave A, but wave C fails to reach beyond the end of wave A. Running Flats are very rare and alternative wave counts should therefore always be considered before labeling anything as a running flat, especially on larger scales.
- Whenever an impulse (trend) ends in what looks like a 3-wave swing and then reverse sharply, be mindful that it could be an expanding flat and that the old trend direction may resume suddenly.
Elliott Wave with Fibonacci Retracement and Extension Guidelines:
- Refer to image for main retracement and extension targets.
- Wave C is usually 100% – 161.8% x Wave A in size, but it is possible that it becomes as big as 261.8% on rare occasions. Sometimes the target for wave C can also be gauged by using the start of Wave A as the base for the 161.8% extension target (instead of using the start of wave C as the base). This method creates a slightly different price level and broadens the target area a little.
Corrective Wave: TRIANGLE
 Note: The internal zigzag structure is only shown it the Contracting Triangle example in order to avoid clutteringthe drawing with too many lines. Please be aware that all waves within all triangles consist of corrective wave patterns, even if they are not shown in the image.
Rules:
- A triangle consists of 5 corrective waves (ABCDE)
- A triangle can only appear in the position of wave 4 of an impulse, wave B/X of zigzags and flats , wave Y of double three sideways corrections, or wave Z of triple three sideways corrections.
- At least 4 of the 5 waves subdivide into zigzags.
- A triangle never has more than one complex wave. The complex wave within a triangle can only be a double/triple zig-zag or a triangle itself.
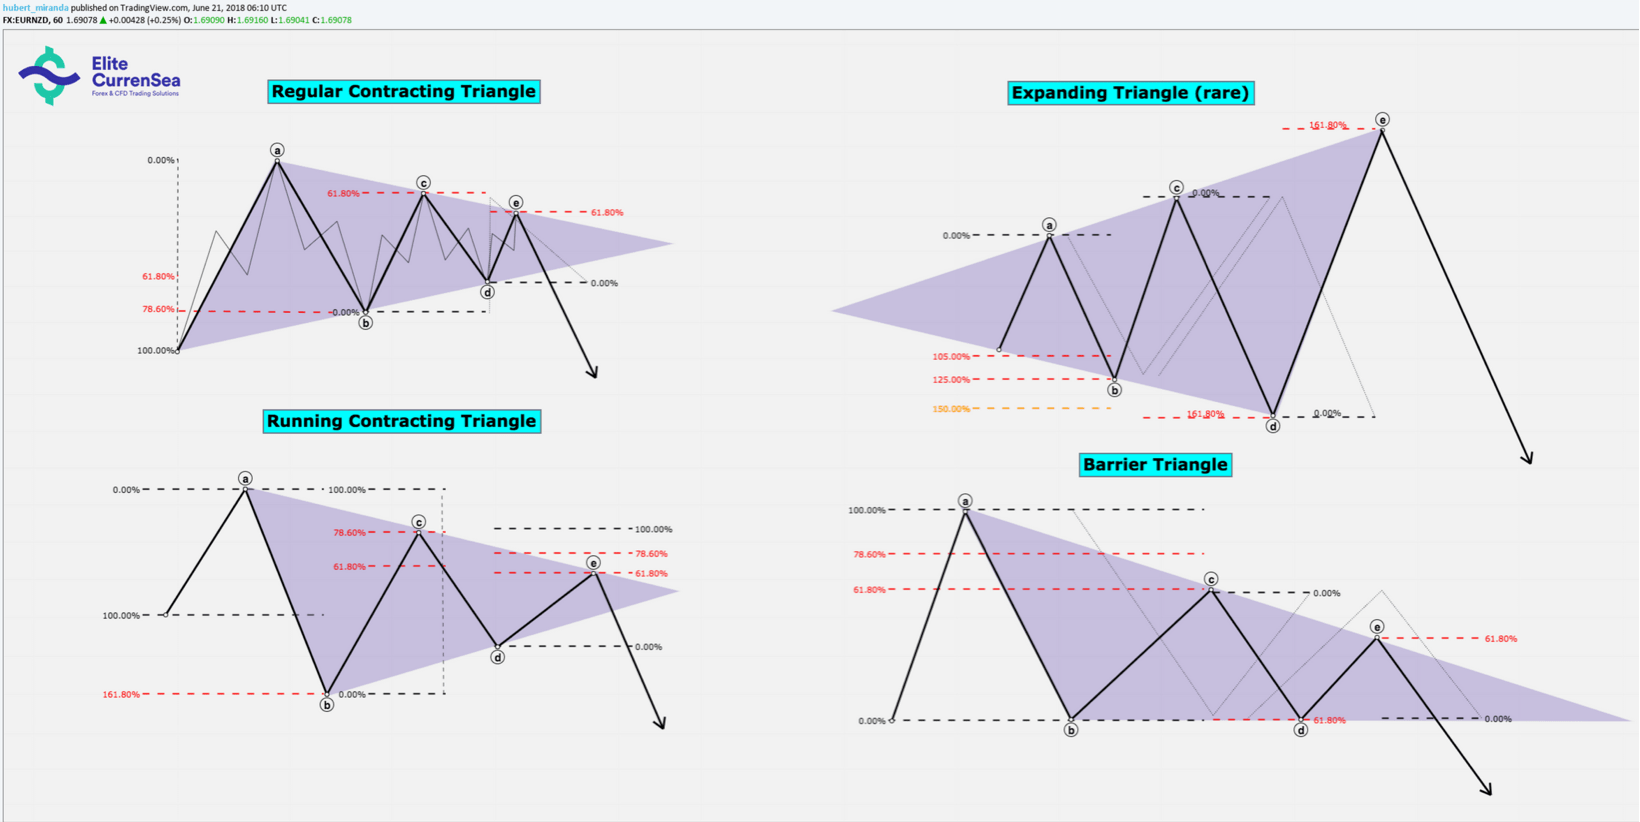
- In contracting & barrier triangles, Wave C does not move beyond wave A, wave D does not move beyond wave B, and wave E does not move beyond wave C. This results in two converging trend lines forming as the triangle progresses. The main difference between a barrier triangle is that it creates a virtually horizontal trend line between points B and D.
- In an expanding triangle, Waves B, C, D, and E must retrace at least 100% of the previous wave, but no more than 150%. This results in two diverging trend lines forming formed as the triangle progresses.
Guidelines:
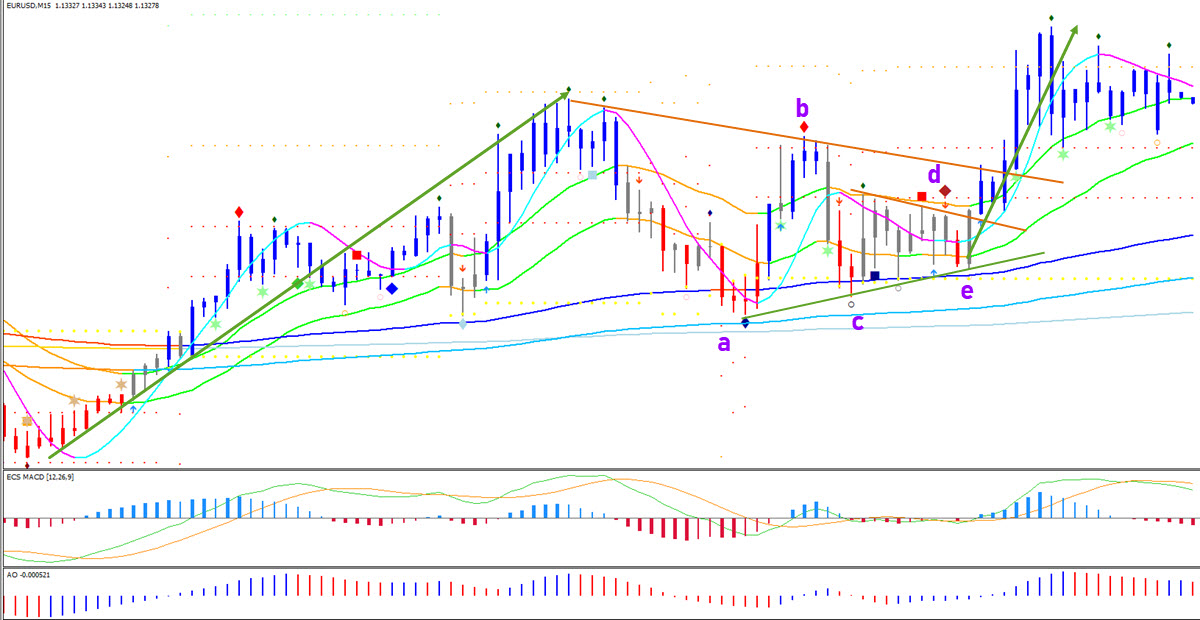
- In a contracting triangle, wave B can end beyond the start of wave A (about 60% of the time). The structure is then called a ‘Running’ Contracting Triangle (see image)
- Wave E will quite likely undershoot or overshoot the triangle trend line. This is normal.
- Expanding triangles and barrier triangles are much more rare than contracting triangles.
- Often, one of the waves becomes complex. It tends to be wave C or D that turns into a complex zigzag (double/triple). Sometimes wave C, D, or E turns into a barrier or contracting triangle by itself. If the final wave E turns into a triangle, the whole structure appears to extend into 9 waves, which become ever more narrow. The triangle then gets labeled as A-B-C-D-E-F-G-H-I
- During contracting and barrier triangles, momentum and volume decreases
- There is usually a (wave 5) post-triangle thrust after wave E is finished, which will roughly be the same size as the width of the trend lines at the start of the triangle.
- The (wave 5) post-triangle thrust in commodity prices is usually the longest wave of the entire trend.
Elliott Wave Fibonacci Retracement and Extension Guidelines:
- In a contracting or barrier triangle many waves have a 61.8% – 78.6% relationship to the previous wave or alternating wave
- In running triangles, wave B should retrace wave A no more than 161.8%
- In an expanding triangle, wave C is usually 161.8% of wave A , wave D is 161.8% of wave B, and wave E is 161.8% of wave C
- See image for more details
Corrective Wave: COMPLEX COMBINATIONS
(Please note that complex ZigZag combinations are covered under the Zigzag section earlier on. The following section only deals with complex sideways combinations)
 Rules:
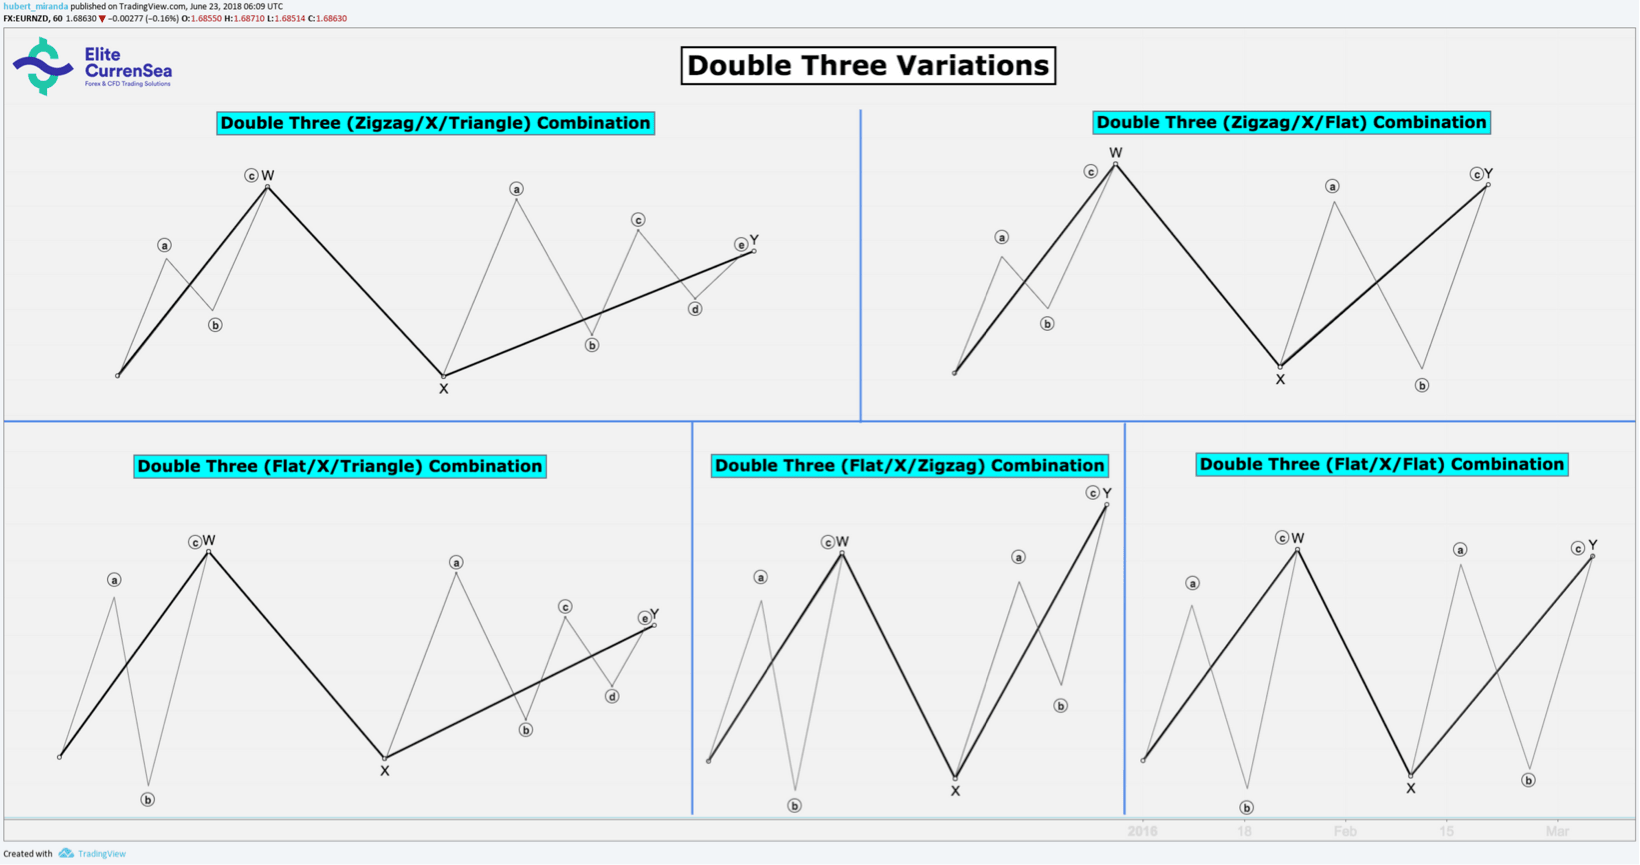
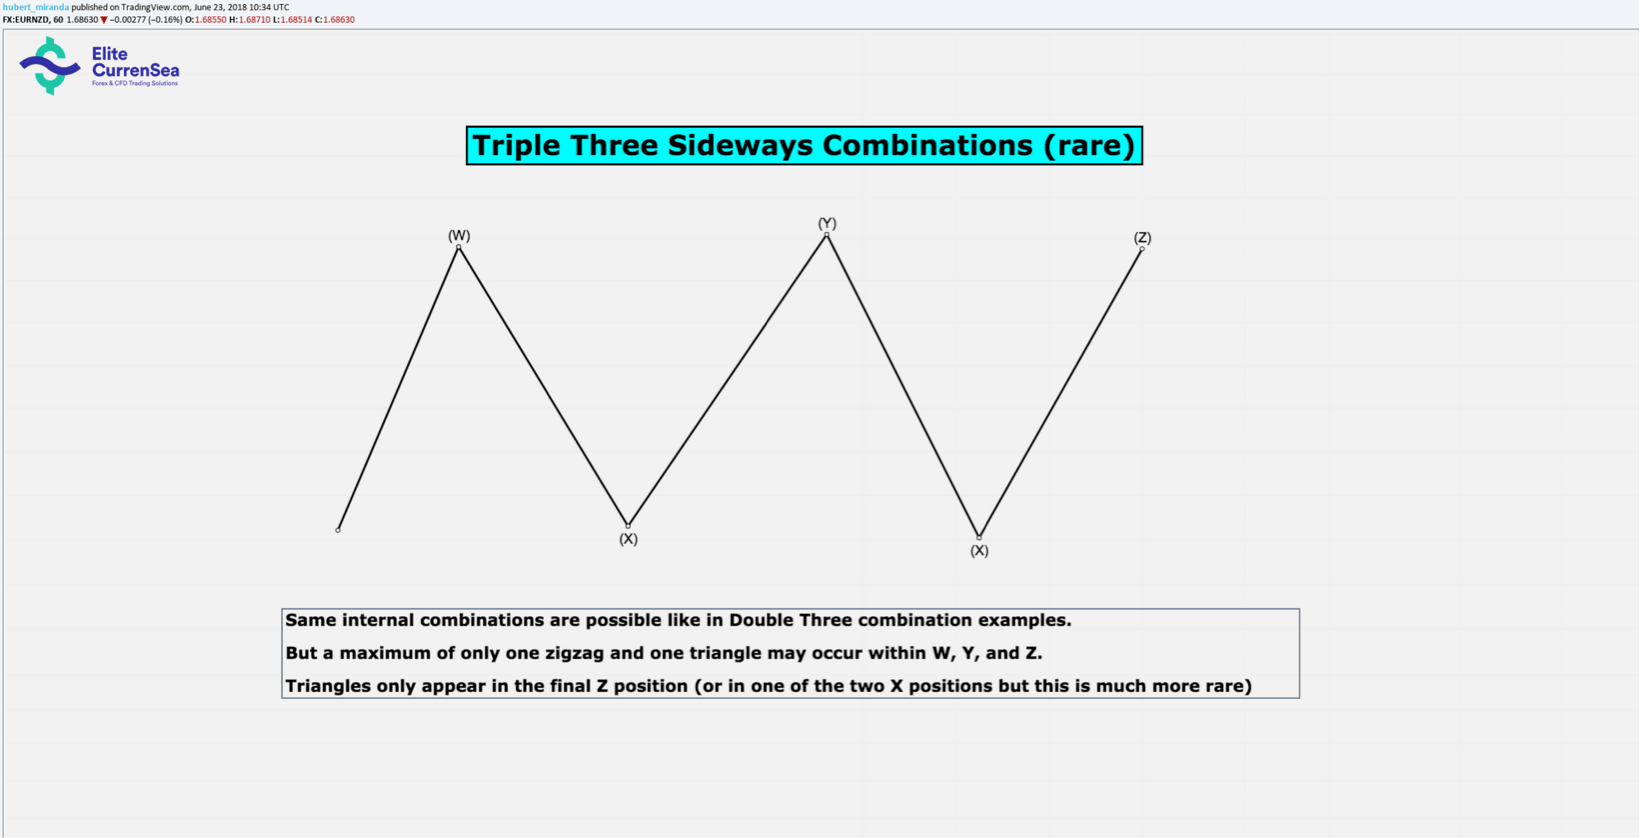
- A complex sideways combination consists of three or five corrective patterns, which alternate in their orientation, thereby creating a complex sideways motion. The central, dividing corrective patterns (X waves) always orientate in the direction of the previously established trend. A ‘Double Three’ combination is therefore essentially made up of 3 corrective patterns (W-X-Y) in alternating directions, and a ‘Triple Three’ combination consists of 5 corrective patterns (W-X-Y-X-Z) in alternating directions.
- A double-three can have the following combination of corrections:
-
- zig-zag (W), any corrective wave (X) and flat (Y)
- zig-zag (W), any corrective wave(X) and triangle (Y)
- flat (W) any corrective wave (X), and triangle (Y)
- flat (W), any corrective wave (X), and flat (Y)
- flat (W), any corrective wave (X), and zig-zag (Y)
- Double Threes are only allowed to have a maximum of one zigzag and one triangle in the W and Y positions. But wave X can be any corrective pattern in addition (including double or triple three combinations of a smaller degree!).
- A Triple Three works in the same manner as a Double Three, and it also only allowed to have one zigzag and one triangle in the W, Y, and Z positions. X waves in a Triple Three can be any corrective patterns in addition (including double or triple three combinations of a smaller degree!)
- Triangles are only allowed to form in the final wave of the combination sequence (i.e. in a Double-Three during wave Y, or in a Triple Three during wave Z).
- IMPORTANT NOTE: Opinions differ amongst Elliott Wave researchers over whether or not waves W, Y, and Z are also allowed to be complex combinations within themselves (e.g. a smaller wxy within W, and so on). The original research presented that W, Y and Z each need to be able to be broken down into a simple corrective pattern (i.e. zigzag, flat, or triangle) at the next smaller degree, and only X-waves could in principle sprout smaller combinations inside themselves. However, some modern analysts are proposing that market behaviour is more complex these days and are validating potentially labelling smaller complex corrections inside W, Y and Z as well. Personally, I have so far not found any use by further complicating the potential of wave W, Y and Z. In the contrary, I have found that it can lead to ‘over-labelling’ of corrections and cause misjudgements in regards to the start of trend continuation or correction targets. If you are starting out with Elliott Waves, I would recommend to stay with the original rules that W, Y and Z should be able to be broken down into simple corrections patterns.
Guidelines:
- Triple Threes are very rare compared to Double Threes
- Even though X waves could in theory also be a triangle, in addition to a triangle in the final wave of a combination, this has never occurred and most likely never will, simply due to the underlying market dynamics. Therefore the final Y or Z will almost certainly never be another triangle, if an X-wave was already a triangle.
- Expanding triangles are extremely rare within a complex combination and have probably never been witnessed (as far as is publicly known
Elliott Wave Fibonacci Retracement and Extension Guidelines:
- Sideways combinations are by their nature range bound. Generally, all waves retrace each other around 78% – 138%, creating either a virtually horizontal movement, or a channel that is very gently sloping against the previous trend direction.
Important Concepts To Remember Before Applying EW Counts
Wave Degrees
Elliott Waves are labeled in different degrees that are nested within each other due to the fractal nature of price movements. Please refer to your Elliott Wave drawing software for the appropriate names and symbols used for each officially defined degree. Alternatively, you may simply label different degrees with different-colored labels on your chart.
Alternation (“expect a difference in the next expression of a similar pattern”):
EW patterns have the tendency to create alternation within them. This is reflective of nature’s general propensity towards dynamic balance. Following is a list of the main occurrences of alternation:
Alternation of corrective waves:
- If wave 2 is sharp (i.e. zigzag or extended zigzag) and deep (i.e. deep in the sense of how much it retraces the preceding wave 1), then wave 4 will most likely going to be sideways (flat, combination, or triangle) and shallow relative to wave 3. The same applies in reverse but is less common. This is because triangles (which only appear during wave 4 inside a motive wave) are considered to be alternating to all other corrective patterns. That means even if wave 2 is a shallow sideways correction, a triangle can still appear in wave 4, but it is less likely.
- Alternation also occurs in terms of wave complexity. If a potential bigger complex correction starts out simple at first, then expect complexity to increase during the following parts of the correction (i.e. simple-complex-most complex). The reverse can also apply (i.e. most complex-complex-simple) but it is more rare.
Alternation of motive waves:
- If wave 1 is short, then wave 3 is likely to be extended, and wave 5 likely to be short again. If wave 1 is extended, then wave 3 and 5 are most likely not extended. If neither wave 1 nor wave 3 is extended, then wave 5 probably will be extended. If wave 3 is extremely long and overstretched, wave is 5 more in danger of being truncated.
Balanced Proportions (“The Right Look”):
It is important that waves within a 5-wave or 3-wave sequence show reasonably balanced proportions to each other… not just in terms of size/magnitude (which can generally be verified by Fibonacci retracement and extension ratios), but also in terms of time duration. This balancing can occur either via alternation and/or via equality.
Consider the following as an example for ‘balance through alternation’: an impulse is showing a classic deep and short-lived wave 2, plus a shallow but time-lengthy wave 4. The time-lengthiness of wave 4 is in balance with the depth of wave 2, while the shallowness of wave 4 is in balance with the short-lived nature of wave 2, thereby creating balance through alternation.
The same need for balance applies for any motive waves within a 5-wave sequence (i.e. 1,3, and 5). The exception however will be the potentially extended wave within the sequence. It can/will be much larger in terms of magnitude and time than the other four waves, but the sub-waves (inside the extended wave) must show a balance to each other. The extended wave will also express relatedness to the other waves of the sequence by the angle of the overall price movement (that’s why impulsive motive waves travel quite neatly within parallel channel lines most of the time, even if one of the waves is extended).

Consider the following as an example for ‘balance through equality AND alternation’. Wave 1 and 5 of an impulse sequence are equal in size and duration (equality), while wave 3 is extended (alternation to waves 1 and 5).
Alarm bells should be going off when a potential wave 4 is starting to grow out of proportion in terms of size and duration relative to the other waves of the same degree.
It is dangerous to disregard the factor of balanced proportions during wave counting. Disproportionate and misshapen patterns should be seriously questioned.
The ‘right look’ may not be evident at all degrees of trend simultaneously, so it is best to focus on the degrees that are the clearest.
FAQ:
- What are Wave patterns?
The 5 waves are labelled 12345 and have the following characteristics: impulse (wave 1), correction (wave 2), impulse (wave 3), correction (wave 4), and another impulse (wave 5). The 3 waves are labelled ABC and have the following characteristics: impulse (wave A), correction ( wave B), and impulse (wave C). Impulsive and corrective waves help determine when to enter trades, and in which direction the trend is moving.
- How can I recognize an ABC correction?
The Elliott wave ABC correction is a three wave pattern. It consists of 3 price swings that go against the trend. The first step is therefore to analyse the charts and understand if 1) there is a trend and 2) what direction is the trend. An ABC correction can take place either a) within the trend as part of a wave 2 or wave 4 or b) after the 5 waves with the trend (12345) have been completed. The wave A is against the trend. The wave B with the trend. And the wave C is again against the trend. The ABC correction can take place in different formations, such as ABC zigzags (quick correction in 5-3-5 wave formation) and ABC flat corrections (slower correction in 3-3-5 wave formation), which then generate different ABC correction fib levels.
- How can I make Elliott Wave predictions?
Traders can use the past price swings to understand their character and direction. They can then label the price swings based on the Elliott Wave Theory. Once traders understand the previous waves, they can use the rules and guidelines of the Elliott Wave Theory to estimate the current wave and future waves. This estimate is a Elliott Wave prediction. Wave predictions will eventually become confirmed (correct) or invalidated (incorrect). Each wave pattern has confirmation levels (breakout beyond support or resistance) and patterns (certain price movement like a bull flag for instance). Each wave also has invalidation levels (breaking an opposite level) and patterns (an opposite pattern). Traders can use these levels and patterns to update their wave analysis in real-time as they receive more information about the chart.
- What is wave analysis?
Wave analysis is based on the concept that price charts and financial markets follow specific patterns called waves, which are based on Elliott Wave (EW) Theory. How can traders apply wave analysis? First, traders can analyse price swings by their direction (bullish/bearish) and character (impulsive(quick)/corrective(slow)). Secondly, traders can label those price swings with numbers (1-5) and letters (A-C) according to the Elliott Wave Theory. Thirdly, traders can read the sequence of swings and labels to understand the story of the waves patterns and understand the expected direction, character, and wave label of the current and next price swings.
- How do you use Elliott Wave in Forex?
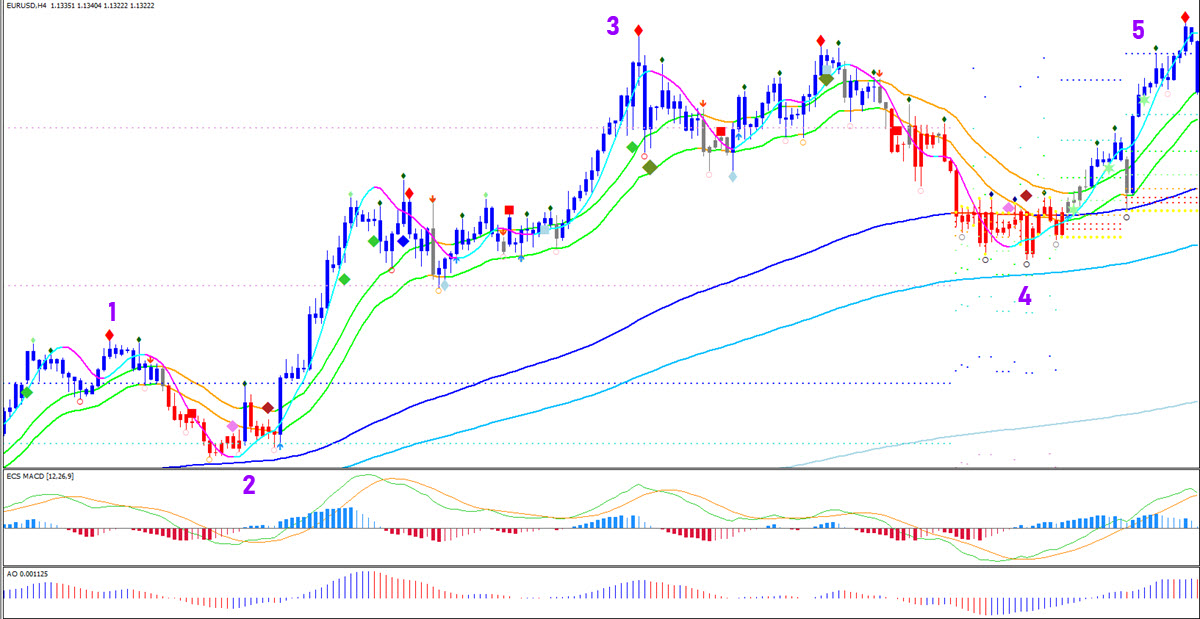
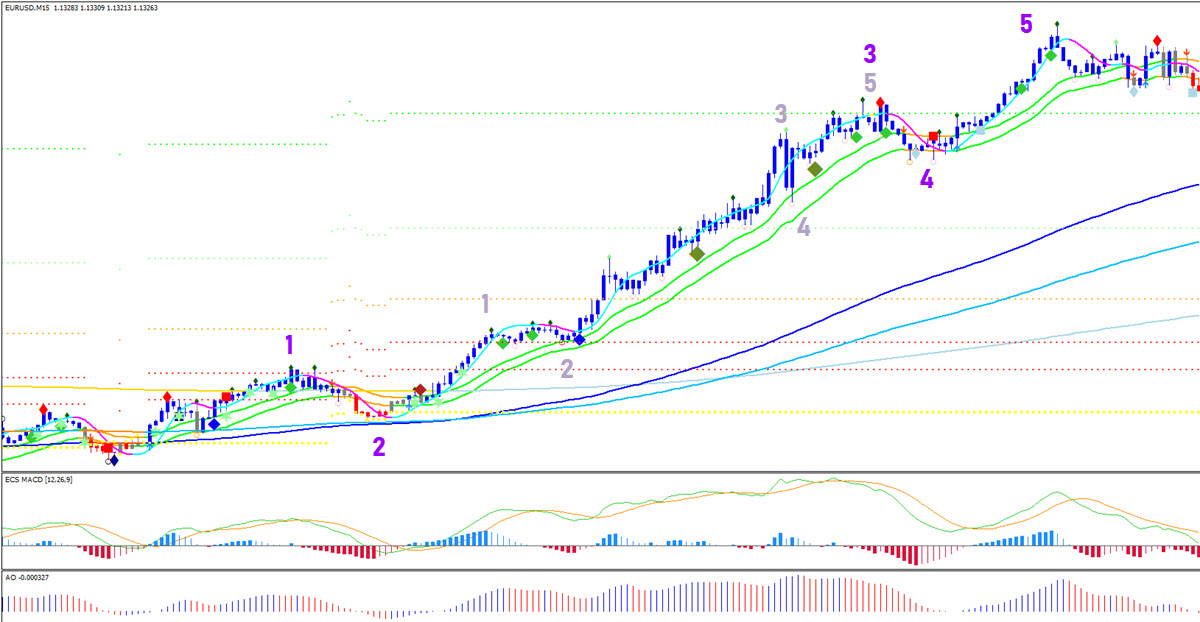
The Elliott Wave in the Forex market is best used by understanding price swings and price patterns, which are supported by using 1) moving averages and 2) concepts of impulsive (quick price) and corrective (slow price) price swings. Traders can ride and trade the waves without counting the waves by understanding how price moves in relation to moving averages (MAs), MAs vs MAs, and the Fractal indicator vs MAs. Using MAs and price swings is a useful short-cut for using Elliott Wave in Forex. My SWAT course 2.0 explains how to use these tools and concepts correctly to analyse and trade wave patterns.
- Does Elliott Wave analysis work? Does Elliott Wave theory work?
Yes, Elliott wave works but more experience is often required and desired. Elliott Waves (EW) are an excellent tool for analysing the markets and for understanding the price movements. But it’s more difficult to determine trade ideas solely based on EW. To solve that experience gap, I often recommend traders to focus on moving averages, Fibonacci, Fractals, and the MACD. These tools help traders digest the price swings in a more systematic method. My SWAT system applies all the important EW principles into a complex yet easy EW Forex trading strategy. It is important that traders implement a consistent and rules based method for reading and understanding the price swings before they trade the waves.
- How long does it take to get waves? How long will it take for a wave formation?
Waves are always visible on the chart. In fact, they never disappear. All candles belong to a price swing. And each price swing is some type of wave. Price swings and waves eventually do finish and new price swings start. This can be best determined by using an oscillator such as the ecs.MACD or Awesome Oscillator. But there are many other useful tactics such as identifying impulsive versus corrective price action. Impulsive waves are usually completed quicker whereas corrective waves develop longer in time.
- Do you have a wave book?
Yes, our wave book consists of 580+ pages. The SWAT ebook discusses Elliott Waves in fine detail. But the guide also reviews chart analysis from A to Z, discussing support & resistance, trend & momentum, and price patterns. The ebook then shows how to translate analysis into actual trading decisions using the SWAT methodology (Simple Wave Analysis & Trading). The main trading tools are based on moving averages, Fibonacci, and Fractals.
- How can I recognize an ABC correction?
The Elliott wave ABC correction is a three wave pattern. It consists of 3 price swings that go against the trend. The first step is therefore to analyse the charts and understand if 1) there is a trend and 2) what direction is the trend. An ABC correction can take place either a) within the trend as part of a wave 2 or wave 4 or b) after the 5 waves with the trend (12345) have been completed. The wave A is against the trend. The wave B with the trend. And the wave C is again against the trend. Often trend traders buy in wave B but their trades get trapped as a larger retracement against the trend takes place in wave C. The Elliott Wave abc correction Fibonacci can break into a number of different internal patterns. The ABC correction can take place in different formations, such as ABC zigzags (quick correction in 5-3-5 wave formation) and ABC flat corrections (slower correction in 3-3-5 wave formation).
- What are Wave patterns?
Wave patterns are identified by the Elliott Wave Theory. The Elliott Wave has rules and guidelines to help recognize a price swing and the correct wave. The waves are split into 5 impulsive waves with the trend and 3 corrective waves against the trend. The 5 waves are labelled 12345 and have the following characteristics: impulse (wave 1), correction (wave 2), impulse (wave 3), correction (wave 4), and another impulse (wave 5). The 3 waves are labeled ABC and have the following characteristics: impulse (wave A), correction ( wave B), and impulse (wave C). Impulsive and corrective waves help determine when to enter trades, and in which direction the trend is moving.
- How can I make Elliott Wave predictions?
Elliott Wave can be used to understand the flow of price action and the market psychology in general. Traders can use the past price swings to understand their character and direction. They can then label the price swings based on the Elliott Wave Theory. Once traders understand the previous waves, they can use the rules and guidelines of the Elliott Wave Theory to estimate the current wave and future waves. This estimate is a Elliott Wave prediction. For instance, let us assume that there are 5 waves up that formed, followed by an ABC down. The bullish price action is against the previous downtrend. This could indicate a wave 1-2 pattern. What is the next Elliott Wave? A wave 3! This is an example of an Elliott Wave prediction. Wave predictions will eventually become confirmed (correct) or invalidated (incorrect). Each wave pattern has confirmation levels (breakout beyond support or resistance) and patterns (certain price movement like a bull flag for instance). Each wave also has invalidation levels (breaking an opposite level) and patterns (an opposite pattern). Traders can use these Eliott wave Fibonacci levels and patterns to update their wave analysis in real-time as they receive more information about the chart.
- What is wave analysis?
Wave analysis is based on the concept that price charts and financial markets follow specific patterns called waves, which are based on Elliott Wave (EW) Theory. EW offers a method to understand the psychology of the price action and price patterns. These repetitive price movements are the result of a natural rhythm of crowd psychology that exists in all markets. How can traders apply wave analysis? First, traders can analyse price swings by their direction (bullish/bearish) and character (impulsive(quick)/corrective(slow)). Secondly, traders can label those price swings with numbers (1-5) and letters (A-C) according to the Elliott Wave Theory. Thirdly, traders can read the sequence of swings and labels to understand the story of the waves patterns and understand the expected direction, character, and wave label of the current and next price swings. My SWAT course explains how to use these tools and concepts correctly to analyse and trade wave patterns.
- How do you use Elliott Wave in Forex?
The Elliott Wave in the Forex market is best used by understanding price swings and price patterns, which are supported by using 1) moving averages and 2) concepts of impulsive (quick price) and corrective (slow price) price swings. Traders can ride and trade the waves without counting the waves by understanding how price moves in relation to moving averages (MAs), MAs vs MAs, and the Fractal indicator vs MAs. Although the Elliott Wave Theory offers traders rules and guidelines for using waves on Forex charts, it is often difficult to implement ideas on live charts and without sufficient experience. Using MAs and price swings is a useful short-cut for using Elliott Wave in Forex. My SWAT course explains how to use these tools and concepts correctly to analyse and trade wave patterns.
- Does Elliott Wave analysis work? Does Elliott Wave theory work?
Yes Elliott wave works but more experience is often required and desired. Elliott Waves (EW) are an excellent tool for analysing the markets and for understanding the price movements and market psychology. But it’s more difficult to determine trade ideas solely based on EW. The EW patterns work much better as a supportive tool.
To solve that experience gap, I often recommend traders to focus on moving averages, Fibonacci, Fractals, and the MACD. These tools help traders digest the price swings in a more systematic method. I also tell traders to focus on wave patterns that are simple to breakdown.
Unfortunately not many systems use EW principles. To solve the problem, SWAT system applies all the important EW principles into a complex yet easy EW Forex trading strategy. My method focuses on simple to understand rules based on moving averages, Fibonacci, Fractals, and the MACD.
- How do you trade Elliott Waves?
Trading Elliott Waves is difficult and requires a lot of experience. The best way to trade Elliott Waves is by using price indicators such as moving averages, Fibonacci, Fractals, and the MACD (or Awesome Oscillator) in combination with candlestick patterns plus impulsive and corrective price swings. Elliott Waves and Fibonacci are usually the go-to. with These tools help remove some of the guesswork from analysing and labelling price swings. It is important that traders implement a consistent and rules based method for reading and understanding the price swings before they trade the waves. The danger of trading waves blindly (no indicators or price patterns) is that traders often lack the experience to accurately evaluate the correct wave formation. Trading Elliott Waves is best done after traders can correctly analyze the price movements, using MAs, Fibs, candlestick patterns and other tools. My SWAT course explains how to use these tools and concepts correctly to analyse and trade wave patterns.
- How do you trade Elliott Waves for beginners?
Trading Elliott Waves is not recommended for beginners. Beginning traders should first learn to analyse waves before active trading Elliott Waves. The first step to analysing waves is understanding price swings and the character of price swings. Price indicators, candlestick patterns, and impulse (quick) and correction (slow) concepts help determine those price swings. The best price indicators for analysing and trading swings are moving averages, Fibonacci, Fractals, and the MACD (or Awesome Oscillator). My SWAT course explains how to use these tools and concepts correctly to analyse and trade Elliott Wave patterns.
- How reliable is the Elliott Wave analysis in forecasting the market
Elliott Wave (EW) is a reliable tool for analysing price movements and financial markets. But experience is required to translate that analysis into trade ideas. The benefit of the Elliott Wave Theory is simple – it allows you to understand the psychology of price movement in the Forex, CFD and other financial markets.
By understanding the psychology between the market waves, an Elliott wave analyst can successfully predict price movements. The Elliott Wave Theory explains how and why price moves as it does — with momentum and correction besides up, down and sideways. Traders can use past and current price swings and wave patterns to analyse future price movement.
The problem is that traders often complain to me about the difficulty of implementing the Elliott Waves correctly when trading. To solve their problem, we advise 3 tips. At first, it’s best to use EW for analysis only and not yet for any trading decisions. Second of all, try to understand the logic of price swings first. Price makes impulsive and corrective price swings. EW theory labels those price swings and tries to understand their sequence. Thirdly, be patient when learning EW. It takes time and the best approach is to develop your skills step by step.
To understand Elliott Wave fully, please take a look at the SWAT system which is extremely useful in approaching and trading markets with Elliott wave analysis. My method removes the guesswork from EW analysis by showing how price swings interact with moving averages, Fibonacci, and Fractals.
- What is the Elliott Wave theory?
Elliott Wave Theory allows you to understand the psychology of price movement in the Forex, CFD and other financial markets. It’is a method of technical analysis which identifies price swings and adds labels to understand the sequence of the waves. Ralph Nelson Elliott discovered the pattern and theory in the 1930s.
The basic premise of the EW theory is that a market forms 5 impulsive waves with the trend followed by 3 corrective waves against the trend. This market pattern repeats on all price instruments. It is also visible on smaller and higher time frames because the market is fractal in nature (price patterns repeat on all scales). Traders can use past and current price swings and wave patterns to analyse future price movement. My SWAT course explains how to use these tools and concepts correctly to analyse and trade Elliott Wave patterns.
- What is the Elliott Wave in Forex?
The Elliott Wave (EW) Theory works the same for all financial markets, including the Forex market. That said, some small 1-2 pips break of the EW rules and guidelines can occur on highly leveraged instruments such as the Forex market. This is especially true on lower time frames and during periods of high price volatility. Otherwise, price swings, the EW theory, and wave analysis work well on the Forex market, just as with any other financial instrument that has sufficient volume. My SWAT course explains how to use these tools and concepts correctly to analyse and trade Elliott Wave patterns.
- How do you trade a wave?
Trading waves is best done by using price indicators, chart patterns, and candlestick patterns. The main indicators that we recommend are moving averages, Fibonacci, Fractals, trend lines, and the ecs.MACD. The tools allow traders to analyse price swing but also find the right timing for entry and exit. My SWAT course explains how to use these tools and concepts correctly to analyse and trade Elliott Wave patterns.
- How do you count Elliott Waves?
Elliott Waves (EW) are based on 5 impulsive waves and 3 corrective waves. The impulsive waves are labelled 1, 2, 3, 4, or 5 and the corrective waves are A, B, or C. An impulsive wave is usually quick and with the trend. A corrective wave is usually slow and against the trend. The wave patterns repeat on all time frames, scales and instruments / charts. Your wave analysis can either become confirmed when price moves as expected or become invalidated as price moves in an unexpected way. If price invalidates your analysis, you will need to create a new analysis that fits within the EW rules and guidelines. It is normal that you feel more or less confident with your EW analysis depending on the specific situations on the price chart.
EW is often criticized for being too subjective and therefore difficult to trade. Traders can remove the guesswork from analysing EW by using moving averages and the ecsMACD oscillator. Analysing the price swings and waves becomes rules based and less subjective when using these methods. My SWAT course explains how to use these tools and concepts correctly to analyse and trade Elliott Wave patterns..
- How do you spot or read Elliott Waves?
To spot or read Elliott Waves, traders need to find a rules based way of identifying price swings. What price action belongs to each other and what is separate? Once traders can find a systematic way of analysing price swings, then they can start analysing waves and adding labels to those waves. After that, they can judge what is the current wave and potential next wave. At first, it is best to use this information for analysis before using it to make any type of trading decision. My SWAT course simplifies the learning curve by explaining a rules based approach for Elliott Wave trading based on moving averages, Fibonacci, Fractals, and the ecs.MACD oscillator.
- What is the best time frame for Elliott Waves?
All time frames are fine for Elliott Waves. But the best time frame is probably the 4 hour chart because it’s fast enough to offer 30 candles in a week but slow enough to digest the new information at a reasonable pace.
- Is Elliott Wave useful?
The Elliott Wave Theory is used for understanding market psychology and the context of the price chart. It is less useful when used as a trading tool. To solve this gap, traders can first gain experience first by using Elliott Wave as an analytical tool for direction and price patterns. Later on, they can start using Elliott Waves as a supporting tool for trading decisions. Elliott Waves become easier to analyse, understand, and trade when using price indicators such as moving averages, Fibonacci, Fractals, and the ecs.MACD oscillator, chart patterns, and candlestick patterns. My SWAT course explains how to use these tools and concepts correctly to analyse and trade Elliott Wave patterns.
Guide Created and Compiled by Hubert Miranda & Chris Svorcik


Hi I found your explanation on EW extremely helpful. Would you know any EW software that can help us in trading FX markets?
Hi Daniel! We have a EW based trading system SWAT, you can find more information about it here: https://www.elitecurrensea.com/wave-analysis-trading-swat/
Hi! this info is really cool and helpful, do you have a time relationships guide for waves? like most common duration in time for corrections to an impulse for example.
Thanks!!
Hi Daniel, thank you! We do not have a time guide yet but makes a lot of sense to me, will try to make one soon 🙂
Thanks! it will improve our price and time analysis in Elliott wave basis. Hope you have the time to do it!
good information , the best
Thank you! We appreciate it
Thank you so much for this! This has been my go to guide for wave analysis. I like the new design too! Thanks for putting in so much effort into building this page. I have told a couple of my friends who are new to trading to use this page to learn everything about analysing the market. Your efforts are much appreciated. Cheers!
Thank you very much for sharing your in depth insights on Elliott Wave Analysis, it has helped me a great deal!
Very good summary. Thanks!
Thanks for taking the time to review our work. Should you need more info about the topic, reach us out!
This is the best guide on the public so far!
This article is very concise and provide a very helpful guide in my trading. I am from Malaysia and mainly trading stock in local bourse. Thanks and salute from me.