Fibonacci Invalidation Points and Stop Losses (Part 11)

The Elite CurrenSea’s Fibonacci series has reviewed multiple ways of placing a Fibonacci tool on the chart. In the last few weeks we discussed placing the Fib on candles, with fractals, via the oscillator, and via a fixed strategy.
Now it is time for the next topic: placing the “dreaded” stop loss on the chart.
The bad news: placing a stop loss on the charts is not a fun activity because it reminds us of losing trades.
The good news: placing stop losses when using Fibonacci is relatively simple!
YOUR STOP LOSS ISSUE
Many traders seek out a tight stop loss in order to increase their lot size (with the same risk). That idea could, however, be hazardous for your account. Why?
1) The Forex market loves moving up and down, loves volatility, and loves retesting price zones.
2) The ‘noise of the market’ implies that all stop losses are to some degree vulnerable to being triggered before price makes a sustainable one directional movement.
3) An (over) tight stop loss will have more issues due to this market volatility.
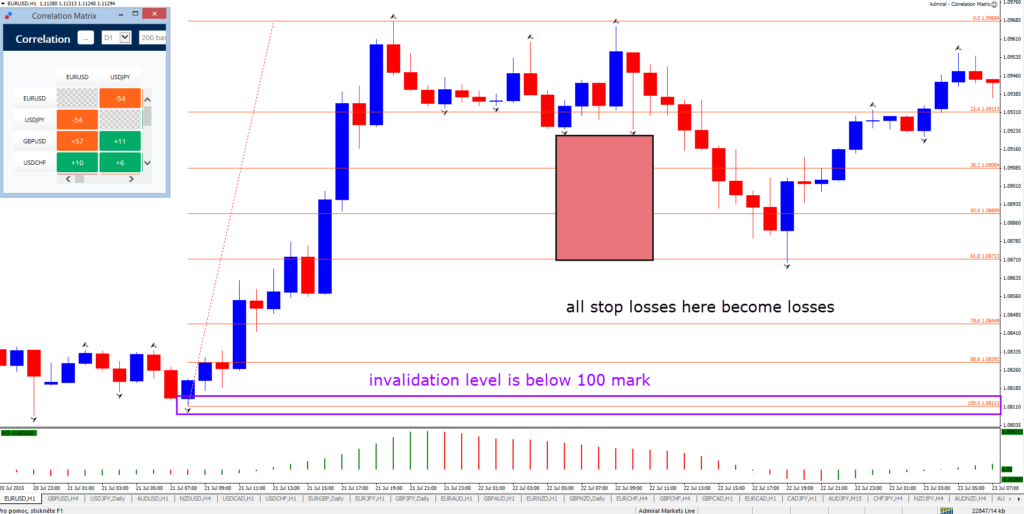
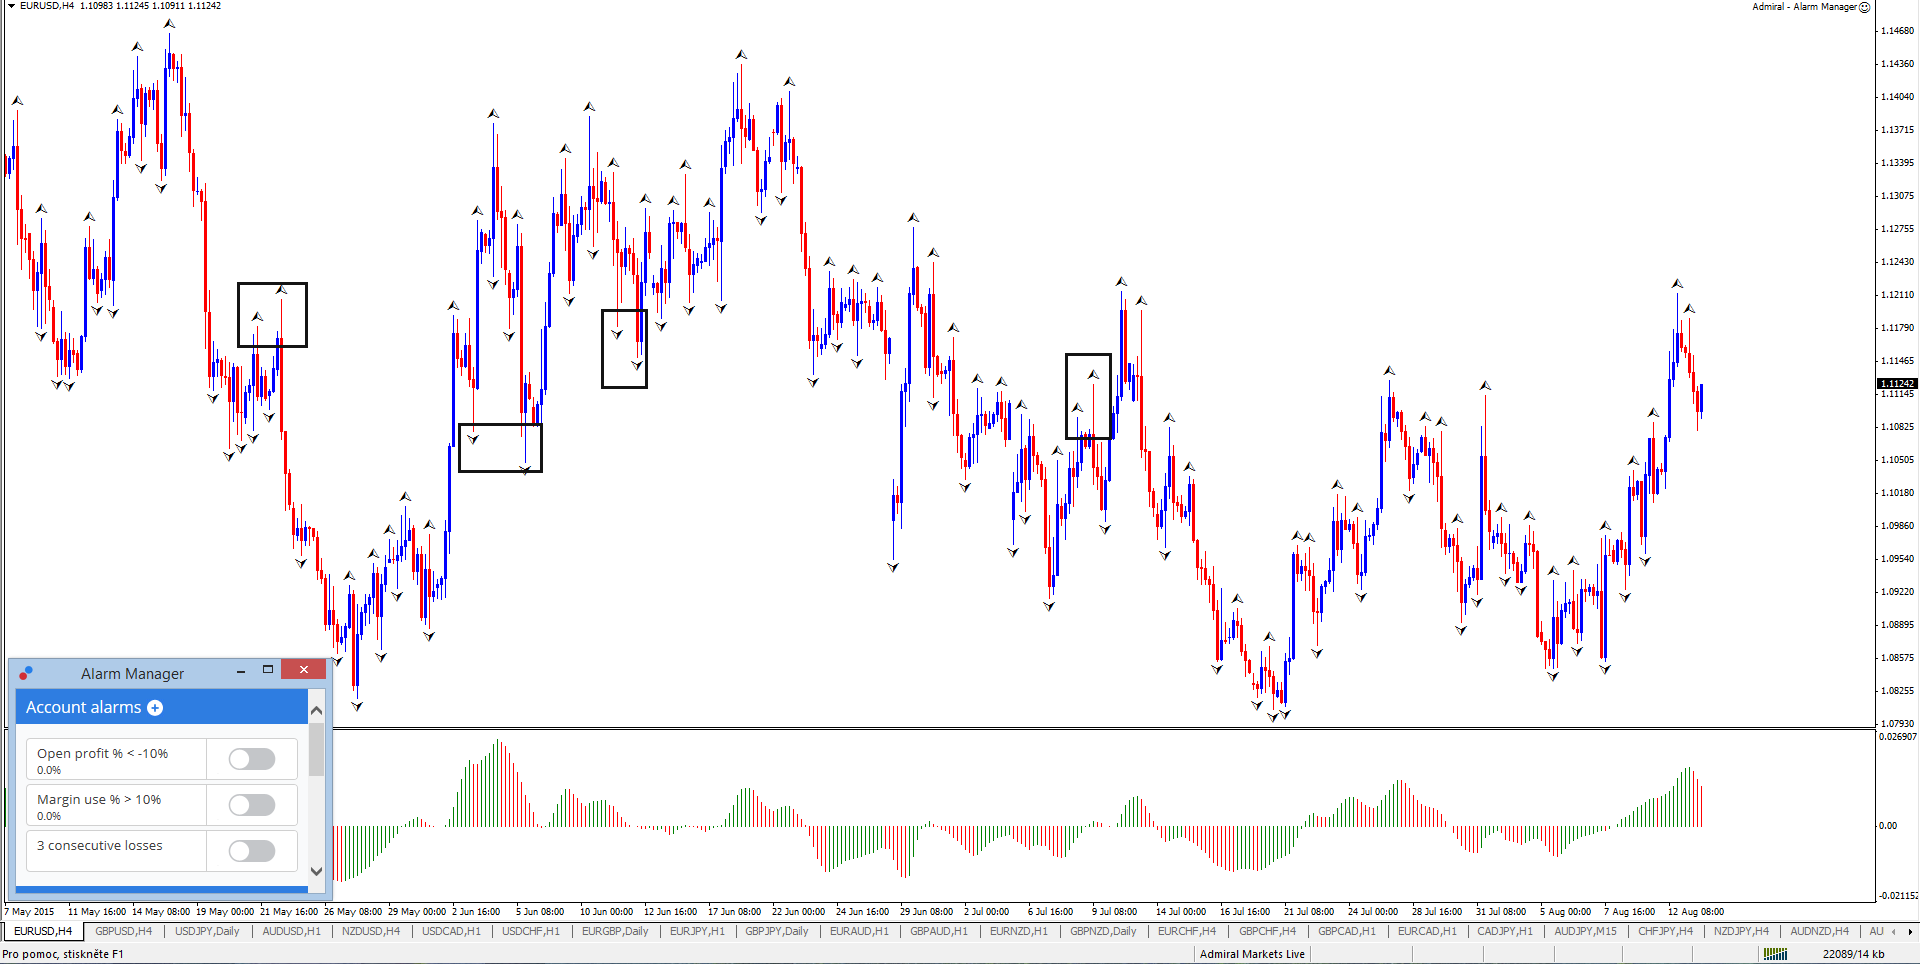
The chart above shows how choppy price action can be hazardous for tight stop losses… but there is a solution! The invalidation spot.
INVALIDATION SPOT
The best stop loss placement is “simple”: place it at a spot where your analysis is INVALIDATED if price pushes beyond that point.
There are 2 benefits:
A) You exit the trade at a loss ONLY if the analysis proves incorrect.
B) You are not psychologically annoyed with the loss.
Many traders do not place a stop loss at an invalidation point. They see their stop loss get hit but their analysis can easily turn out to be right.
Do you recognize the annoyance that your analysis was correct but your trade ends up for a loss? Only to see the market turn around into your expected direction AFTER you get taken out?
This process leads to revenge trading, over risking and other nasty and costly bad habits. Using the invalidation level creates a peace of mind: a stop loss only triggers if the market is turning into a different direction.

Finding the invalidation level with the Fibonacci tool is straightforward: The stop loss should always go below the 100 mark!
When a trader places their Fibonacci tool from left to right (see this video), they will have the 100 mark either at the bottom (when Fibbing an uptrend) OR at the top (when Fibbing a downtrend).
The bottom or top of the Fibonacci level is where the trade and analysis is invalidated because Fib traders will only place the Fib tool on an appropriate / sturdy swing. Now you finally understand better why placing the Fib on the correct swing or leg of price movement is so crucial… the Fib tool not only indicates entries and targets but also the correct stop loss level. Make sure to use the correct swing and hence the correct Fib! (video)
Personally I tend to place the stop loss a few pips away from the bottom or top. On a 1-hour chart this could be 5-10 pips whereas a 4-hour chart might be 10-20 pips. I like to provide more leeway for my trades, just in case price retests the bottom or top.
MIDDLE ZONE PLACEMENT
Some Fibonacci traders use tighter stop losses. They do not use the invalidation level but rather place the stop loss just beyond a Fibonacci retracement or target. Does this make sense?
Yes, it is possible. But realize that you need sufficient experience to know when this is valid OR when this spells DANGER.
Stop losses just beyond a strong Fibonacci level can work out fine and offer better reward to risk ratios. The key element is to have sufficient confluence on the charts at that particular level.
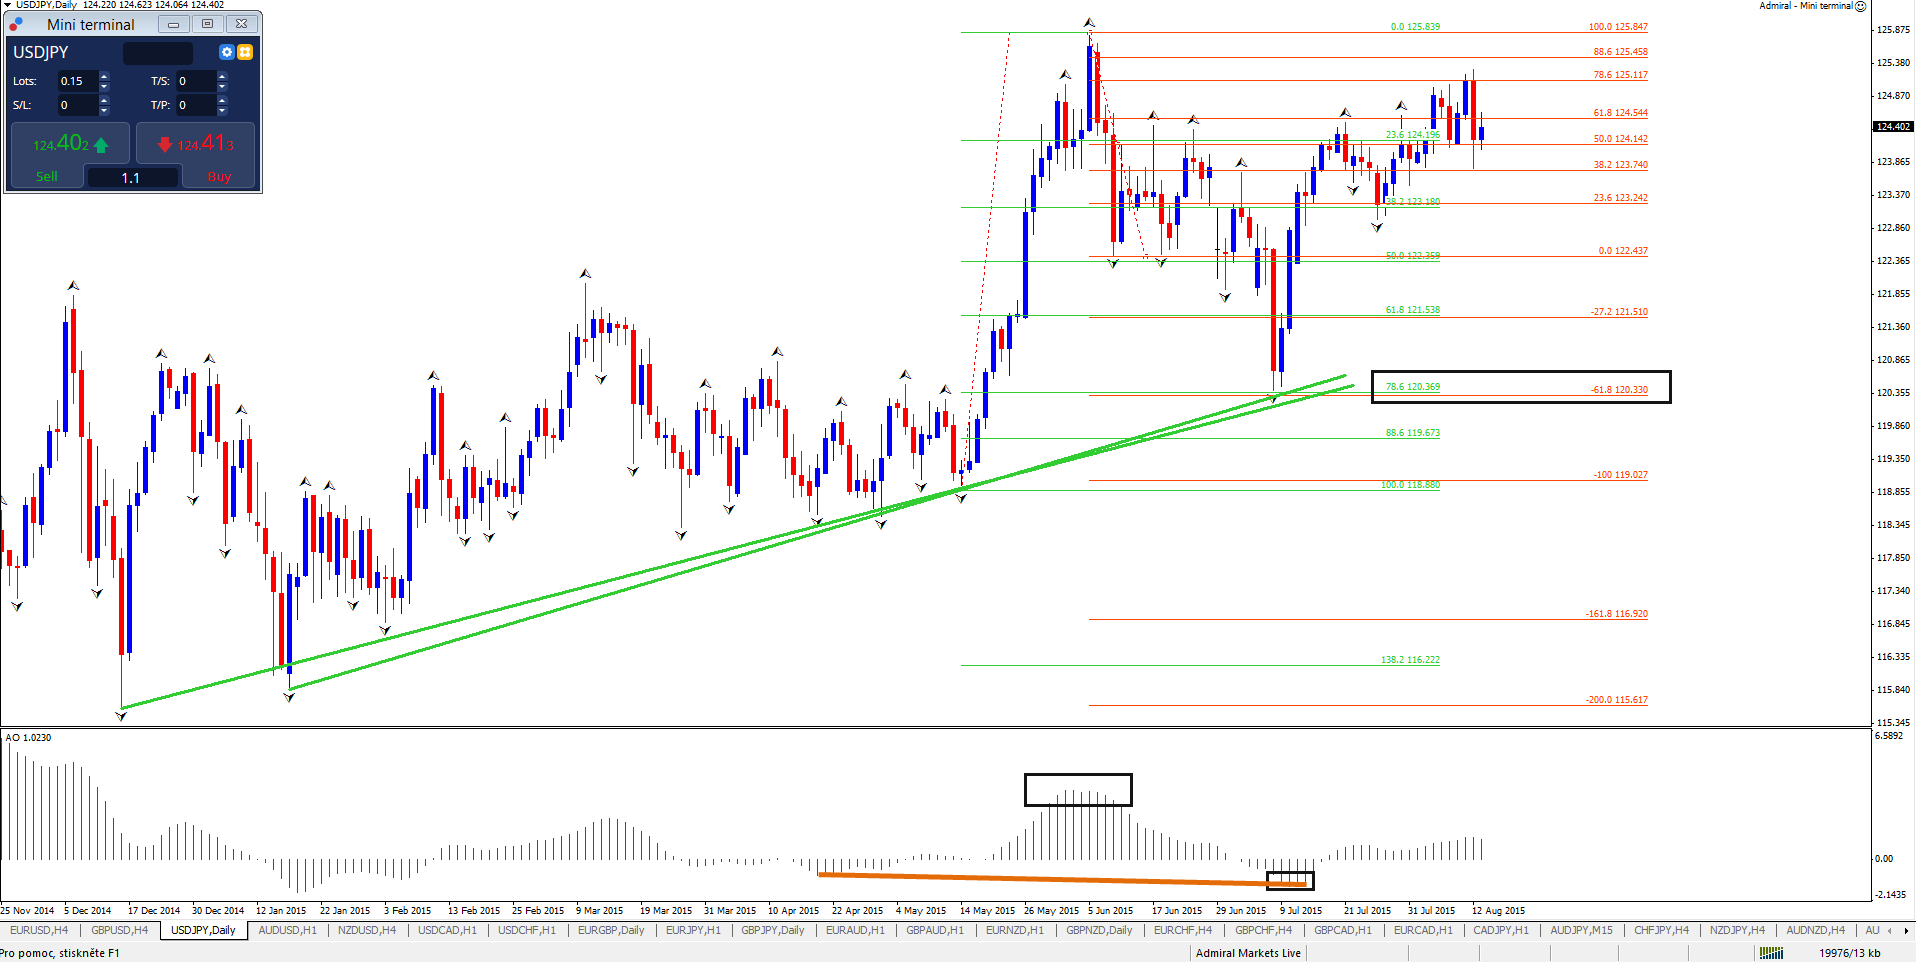
For example, a trader takes a long at the 78.6% Fib of the daily chart. The trader decides to place a stop loss below the 88.6% Fibonacci level and not the bottom, which saves them some 80 pips. This is a case where chart confluence is clearly visible:
- General uptrend present on higher time frame, on daily downside is a correction too
- Fibonacci levels on daily charts tend to be strong
- There is confluence of Fib retracement (green) and Fib target (orange) at the same level
- Trend line support is providing extra strength (green)
- The oscillator is showing retracement compared to the strong upside
Be careful when applying this tactic: look for strong confluence and test it properly.
Before leaving, make sure to read our entire Fibonacci series!
Thanks for tuning in,
Chris Svorcik


Leave a Reply