Fibonacci Sequence Levels in Pip Value (part 13)
Subscribe

The Fibonacci numbers are not only valuable in calculating the Fibonacci ratios and Fibonacci targets. They are also very useful for identifying the best moving average numbers AND understanding the distances of price movements. Check out this post to see how Fibonacci levels can be used in more ways than you realized.
In fact using this concept could become key in understanding when and where to expect massive momentum and in which cases to take profit sooner than later. Remember, catching those big winners is crucial in bumping up the equity curve!
PRICE ACTION MOVES WITH FIB NUMBERS
Price action is either moving impulsively (momentum/quick) or correctively (slow). The interesting thing is that in both cases the Forex market tends to make price movement in pip size that corresponds to the Fibonacci sequence levels. Or in other words, price tends to move 13, 21, 34, 55, 89, 144, 233 etc pip movements when trending, retracing and ranging! Basically, price action typically moves in distances that are equal to those sequence levels.
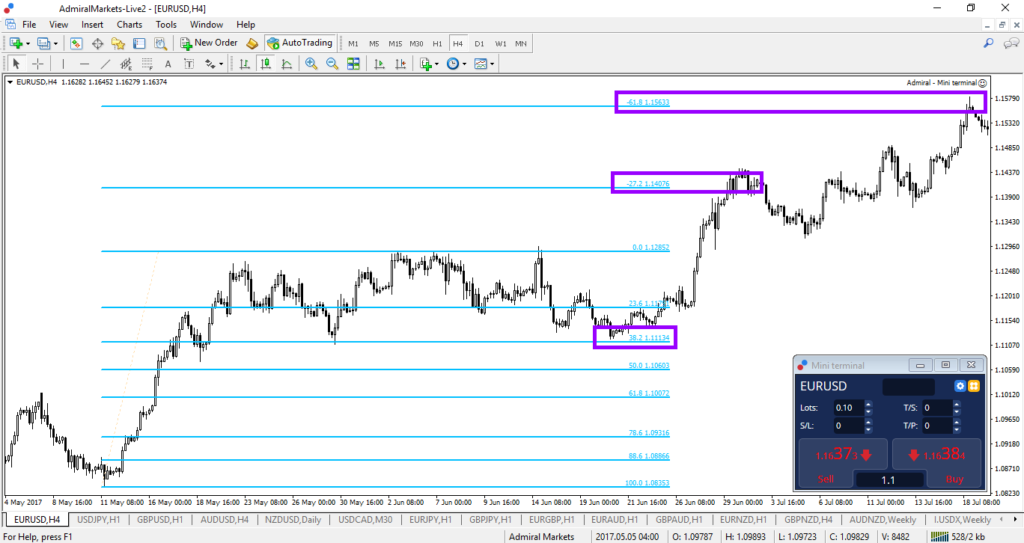
1) A trending environment means that price is breaking past a Fibonacci sequence level and it is heading towards the next one. A price break out above 144 pips usually translates into a price continuation to the next Fibonacci sequence level of 233 pips.
2) A range environment means that price fails to break past a Fibonacci sequence level and remains trapped between Fib numbers that act as support and resistance.

(price is trending in this example as it breaks from level 1 to level 6)
FIBONACCI SEQUENCE LEVELS in PIPS
The concept is that each Fibonacci sequence level is a key support and resistance for the next potential price movement. When price breaks through the 55 pip support (in downtrend) or resistance (in uptrend) then the market typically tends to move towards the next Fibonacci sequence level, which in this case is 89. A break above 89 targets the 144 level. A break above 144 in turn shows potential for a move to 233.
For a 1 hour chart I start counting the Fibonacci sequence from 55 pips and onwards because the Fib sequence levels below 55 are less relevant for higher time frames. For charts below the 1 hour I start counting the Fibonacci sequence from 13 pips onwards. I identify each Fibonacci sequence level as a separate level:
| LEVEL | Day | 1 hour + | 5 min + |
| Level 1: | 233 pips | 55 pips | 13 pips |
| Level 2: | 377 pips | 89 pips | 21 pips |
| Level 3: | 610 pips | 144 pips | 34 pips |
| Level 4: | 987 pips | 233 pips | 55 pips |
| Level 5: | 1597 p | 377 pips | 89 pips |
| Level 6: | 2584 p | 610 pips | 144 pips |
| Level 7 | 4181 p | 987 pips | 233 pips |
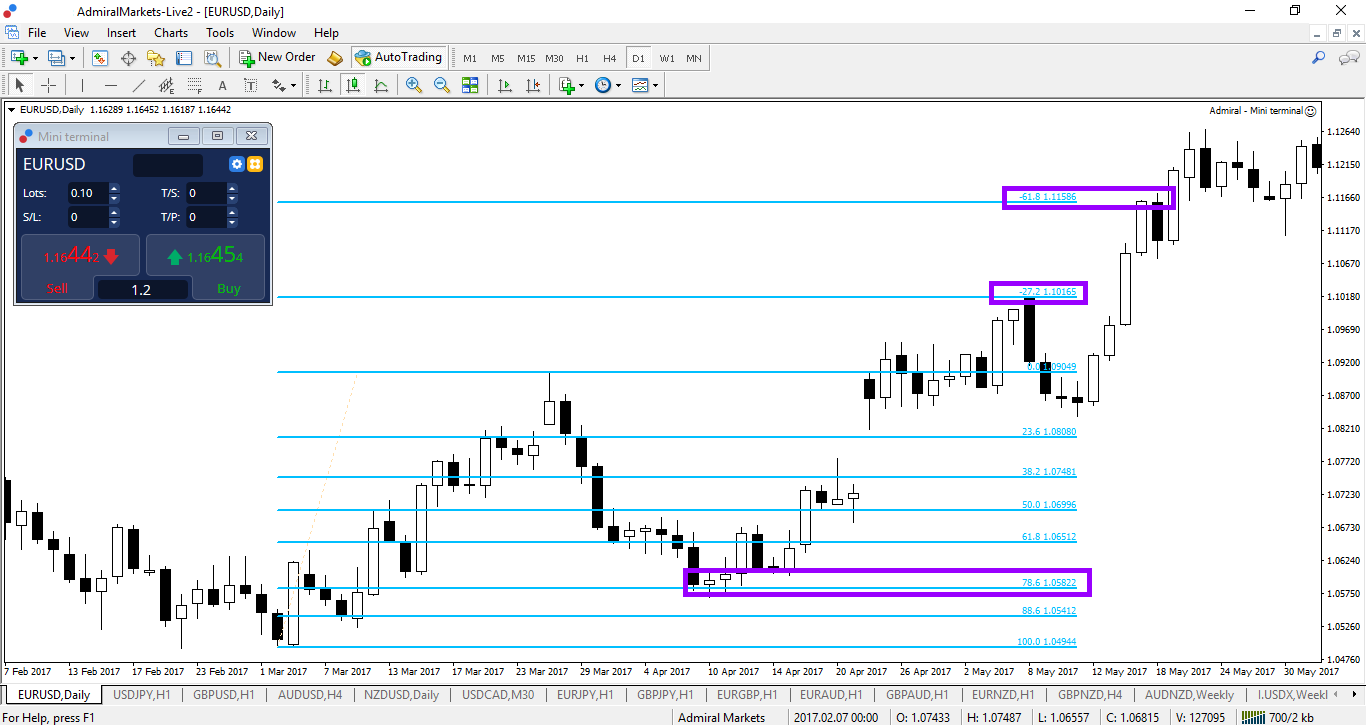
(range environment: price stays long below 3rd purple level)
PURPOSE OF THE PIPS LEVELS
The purpose of these Fibonacci sequence levels is to identify the critical support and resistance levels that usually act as a break or bounce spot. Each of these levels fulfills that role and function. Some levels, however, are more important than others.
Level 3 is critical level for instance because it is often the border between a range environment and a trending mode.
When price respects the Fibonacci sequence level of the 3rd level then it often still is in range. Once price breaks above the 3rd level then typically a trend starts to develop. Price often accelerates and momentum increases as price has more space to move up to higher Fib sequence levels.
This concept is absolutely vital. Knowing when and where the major momentum burst could occur allows traders to let their winners win big when the timing is right and appropriate! It also allows traders to exit positions at the right spot if price is not in a trend and ranging.
MEANING OF THE LEVELS
Here is the general interpretation of each level:
Level 0: starting level or base point = pink line on charts / all other levels are purple / each purple level after the pink is marked as 1, 2, 3 etc.
Level 1-2: 1st and 2nd level closest to base point / range level (when there is no trend) or small retracement level (retrace against trend)
Level 3: furthest range level (no trend present) or medium retracement level (retrace against trend)
Break level 3: signals start of trend
Level 4: occasionally target of large retracement level
Break level 4: trend continuation and momentum acceleration
Level 5: main target of break of level 3
Retrace level 3-4: often used as support or resistance after level 5 is hit
Level 6: main target of bounce at level 3-4
Level 6: price can start to become overextended, especially on EURUSD and AUDUSD pairs but big movers like GBPJPY and EURJPY can move quicker to level 7
Level 7: extra target for big moving currency pairs
(purple moving average indicate 144 and 169 ema close and represent the start and restart moment in trends)
WHEN TO START COUNTING? AND WHEN TO RESTART?
An important factor is where traders should start counting the Fibonacci sequence levels. Obviously a trader who is using different bottoms or tops will also get different pip levels. The start and restart point depends on whether there is a range or trend:
TRENDING PRICE:
In my method the pips counting starts from the 144 ema close moving average. This is the MAIN level and acts as the start and reset spot. I am using the nearest bottom or top at the 144 ema to start my pip count. Each time price goes back to the 144 ema close, then I also restart the count.
When price therefore goes from level 4 to 5 and then perhaps from 5 to 6, the price movement occurs in 1 continuation pattern without a bigger retracement back to the 144 ema close.
RANGING PRICE:
When price is building a range then I do not use the 144 ema. I stick with the top and bottom when price is still in a range or when price retraces against the trend. Those are the most natural points to use when price is retracing or ranging.
USING THE LEVELS
Manually plotting the lines or calculating them is not tough but does require some manual work. Elite CurrenSea has made it easier for you and offers you a chance to buy the ecs.SWAT system that includes a script which plots lines automatically. You can purchase it here: BUY AUTOMATED FIB TOOL and the ENTIRE SWAT COURSE.
Before leaving, make sure to read our entire Fibonacci series!


wonderful Explanation
good luck
Hi arcmssh, thank you for your reply, we appreciate! 🙂