Why Fractal, Fibs and Wave Patterns Explain Market Psychology

Dear Traders,
In my view, there are two types of traders in the world. There are traders who are hunting for easy signals and quick entries… and then there are traders who are willing to learn how to analyze the charts properly.
Signal hunters may earn well, but they are vulnerable to market changes. If their system becomes outdated, they will not know how to respond or adapt. If their signal provider stops or sees their losses increase, they are not ready to tackle the markets on their own two feet. These traders are better off with an EA or an automated trading system.
The willingness to learn, however, changes everything.
Active traders treat market analysis with an open attitude and they are interested in learning how to analyze the market structure. They combine concepts such as trends, patterns, and support and resistance to actively improve their analysis and trading skills. These traders are real manual traders.
This article is intended for those in the latter group, the learners and active traders. We will explain how you can understand the market with more clarity.
The Forex Market is Fractal of Nature
Does the market move erratically? Or is there an order behind the chaos?
According to the Chaos Theory, the apparent randomness of chaotic complex systems depend on their initial conditions. The concept is not that complicated as it seems: basically the ‘chaotic’ behavior is really not as chaotic as it seems.
Simply said, there are underlying patterns that repeat in a similar way on all scales. This phenomenon can be seen in both natural systems, like weather and climate, and artificial elements like road traffic and economics.
And yes, this includes the financial markets in general, and the Forex and CFD markets specifically. The Forex market is Fractal in nature, which means that similar price patterns repeat on all time frames.
We can test this principle real quick: what is the time frame of the chart below?
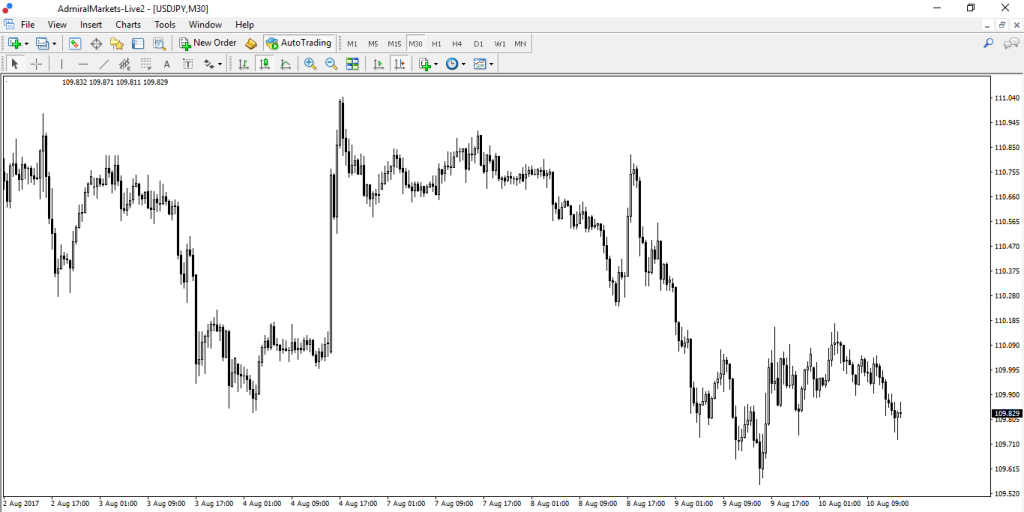
Figure: USD/JPY but which time frame?
It is impossible for us to know for sure. It could be a monthly, daily, 1 hour or 1 minute chart. In fact, it is a 30 minute chart!
So yes, the markets are more like a natural object than a classical mathematical one. Why? Because Forex, CFD and other financial markets are more similar to patterns seen in nature, crystal formations and the weather than in mathematical formula or shape, such as a square.
This brings us to our next question, what drives the occurrence of these same/similar Fractal patterns on all time frames?
The Market Psychology: Wave and Fibonacci Patterns
The financial markets and price action are driven by the collective psychology of the markets.
Some traders might instantly protest by saying that big news events clearly create huge price movement. They do, but perhaps it’s the market perception of the news that ultimately drives price…
Simply said, is the news that drives price or the market reaction to the news that impacts price?
In my view, it’s the market reaction that really matters, not the news itself or even our reaction. The main element is this market psychology…
The next question is therefore: Is there a way to analyse the market psychology?
Luckily yes! The best methods for analysing market psychology are called:
- The Elliott Wave Theory (called waves for short).
- Impulse, correction, swings and overall market structure.
Here are the main reasons:
- Wave analysis identifies repetitive patterns based on the market’s psychology.
- The Wave patterns repeat on all time frames, which make it Fractal in nature.
- Price moves in waves of impulsive and correction.
- Impulse and corrections are all swings within the bigger market structure.
Fibonacci patterns go hand in hand with wave analysis because they indicate when and where the market psychology might change. They also offer potential start and end points of the market psychology.
And last but not last, Fibonacci itself is another example of a Fractal shape and formation. The 0.618 number will repeat and create a golden spiral, which is fractal in nature (see image below).
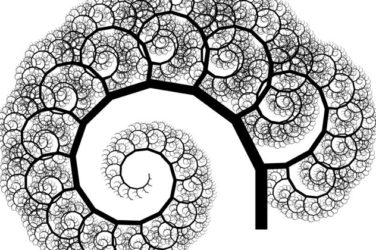
Source: Fractal enlightenment
Basically, we can provide the following summary:
- The financial markets are Fractal of nature.
- The Wave Theory and Market Structure explain the psychology and movement behind the Fractal formations.
- Fibonacci is also Fractal in nature and provides practical levels when the Waves start and end.
The Best Tools for Analyzing the Market
You might be wondering, Chris this sounds interesting but HOW will it help my trading?
Great question!
There are three main reasons why understanding the nature of the market is important for traders because they:
- Are able to setup a balanced trading plan and approach.
- Choose the best tools and indicators for our trading plan.
- Create a flexible mindset that is in sync with the market moves.
This is a simple achievement and it will take dedication. But it is worth the investment of your time and focus…
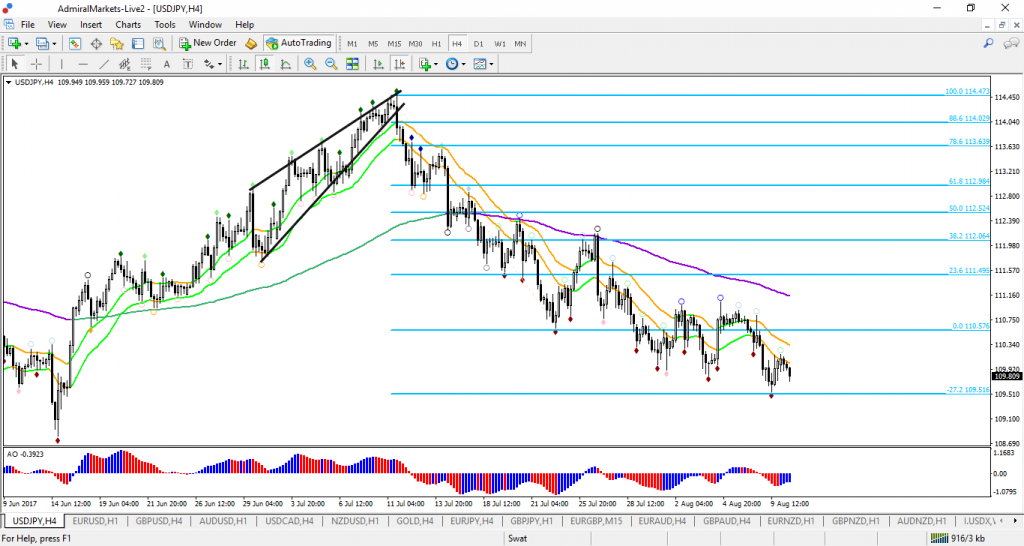
Image: USD/JPY 4 hour chart
Last but not least, what are the best tools to understand the market structure?
We conclude that the following trading tools are the best when analyzing the Fractal nature of the market and understanding how waves and Fibonacci levels help explain price movements:
- Fibonacci → swings, support and resistance
- Fractal Indicator → support and resistance, momentum start and end
- Moving Averages → trend and momentum
- Awesome oscillator → trend and wave patterns
- Wave Patterns → market psychology
- Candlestick Patterns → trend and direction
- Chart Patterns → market psychology
As you can see, the 7 tools mentioned above are most important tools and indicators. They explain trend and momentum, support and resistance, and patterns.
In our upcoming articles, we will explain more details about all of these tools.
If you want a shortcut, we recommend learning ecs.SWAT method.
Many green pips,
Chris
Twitter: @EliteCurrenSea
YouTube: Elite CurrenSea


Leave a Reply