A Guide for Trading Breakouts with the Elliott Wave Theory

Do you find breakouts difficult to trade? Perhaps you think that trading breakouts is impossible… or you feel the need to filter out breakouts more?
Then you are at right place. In this article you will be learning a clear strategy for trading breakout patterns.
The Nature of Breakout Patterns
Breakouts are one of the most famous patterns in the Forex market… but we must mix it up with some other tool to measure the direction of the breakout and whether the breakout will strong or false:
- For direction: use support and resistance trend lines to measure the breakout direction.
- For strength: use candlesticks to measure a strong or weak breakout. A strong breakout has a candle close near the high (bull) or low (bear).
A breakout occurs when price pushes above a correction pattern, such as:
- A flat range
- A triangle
- A wedge
- A flag
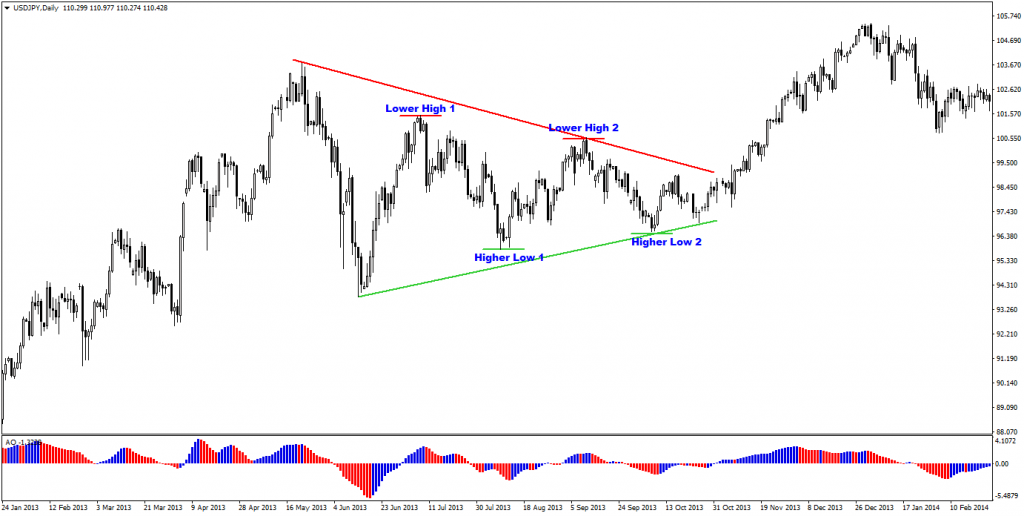
Today, our focus will be on symmetrical (or contracting) triangle breakout. In a triangle, price builds lower highs and higher lows as shown in figure below.

Fig 1: Triangles & Elliott Wave
Elliott Wave & Breakouts:
There are various corrections within the Elliott Wave structure:
- Wave 2
- Wave 4
- Waves ABC
- Waves ABCDE
Wave 2 is typically a deep and quick zigzag. Wave 4 is often a flag, wedge or a flat range. An ABC could be all of the corrective patterns whereas an ABCDE is a triangle pattern.
Implementing the Strategy Rules and the Trading Plan
Here is how a trader can trade the contracting pattern with a step by step explanation. The first step is spot the contracting pattern on the chart. The image below shows two great examples of triangles.
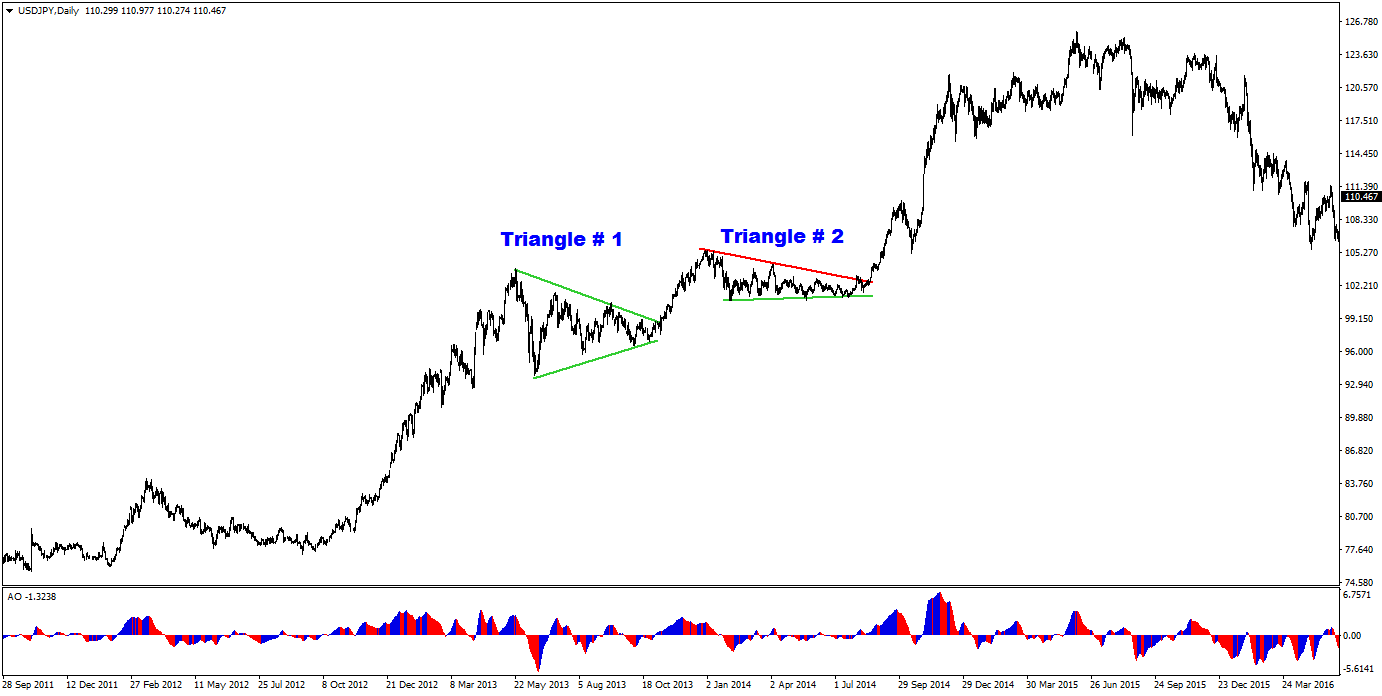
Fig 2: Triangles & Elliott Wave
The next step depends if you are a wave trader or not:
- If you are a wave trader, then you can add the wave analysis and count that you think is valid. See the image below for an explanation of the wave count.
- If you are not a wave trader, then simply try to establish if there is momentum visible and to which direction. In the image below you can see bullish momentum prior to the triangles.
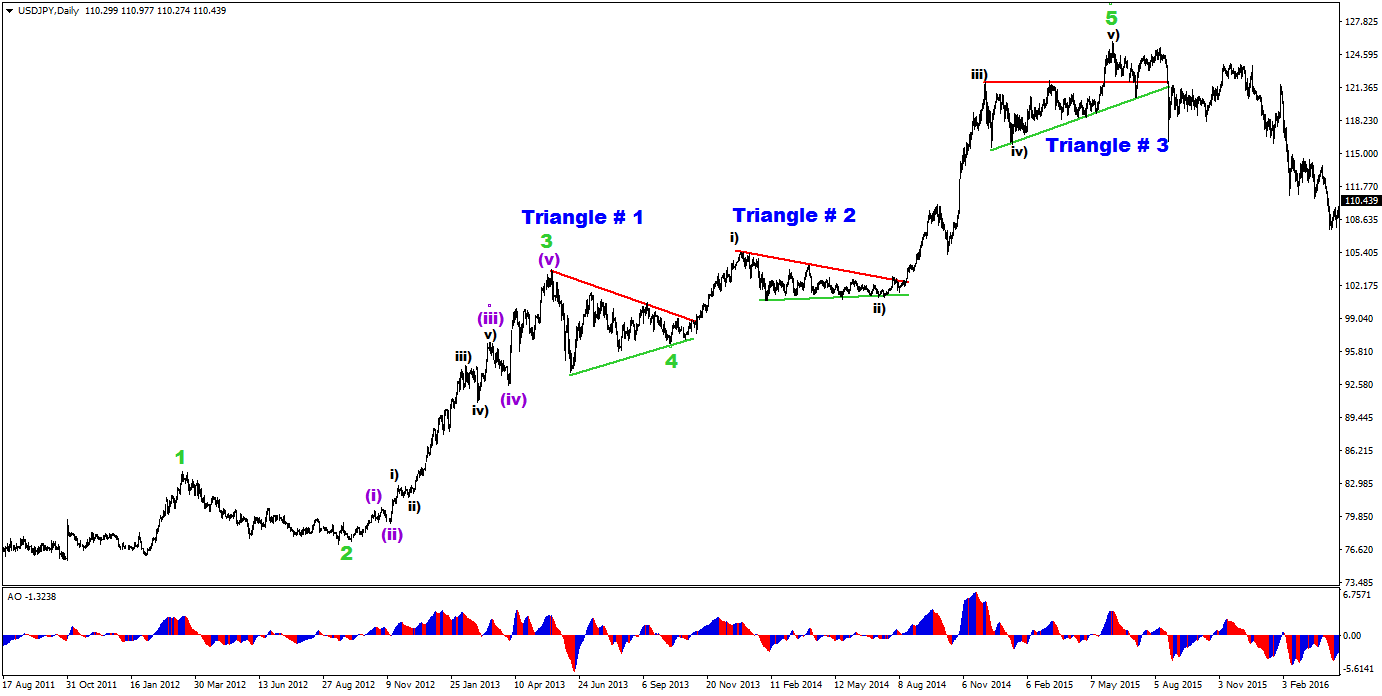
Fig 3: Triangles & Elliott Wave
The next step is to draw the Fibonacci retracement tool from wave 2 to wave 3 for wave traders or from the bottom to top of a strong bullish move for non wave traders. Price bounced at the 38.2% support Fib retracement in the figure below. Traders may can for an entry in 38.2% to 61.8% Fib zone.
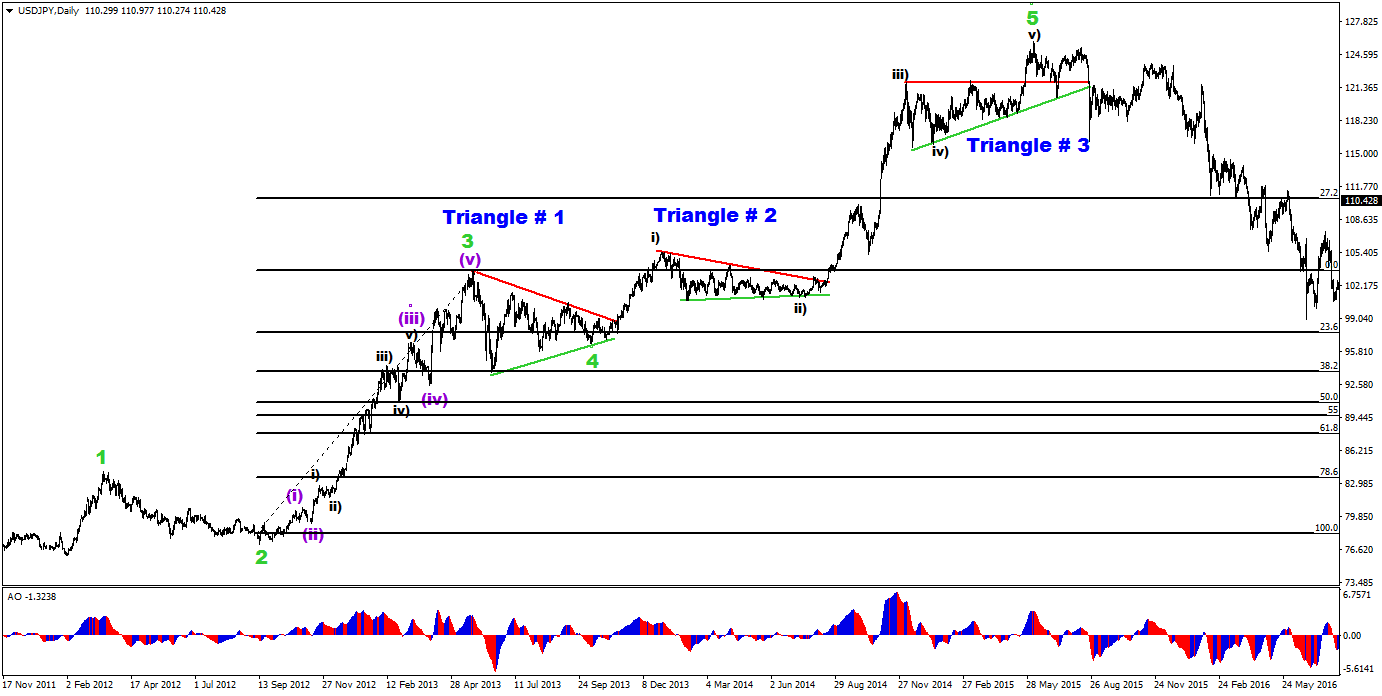
Fig 4: Triangles & Elliott Wave
From an Elliott wave perspective, the chart examples are expected break bullishly. A potential long entry can be placed above the wave D (previous higher high) and stop loss (SL) below wave E.
It’s a good practice to know the wave 4 is invalidated at the top (or bottom) of wave 1 in an uptrend. This is a good spot for stop losses too. For instance, the 61.8% Fib is used in the example below.
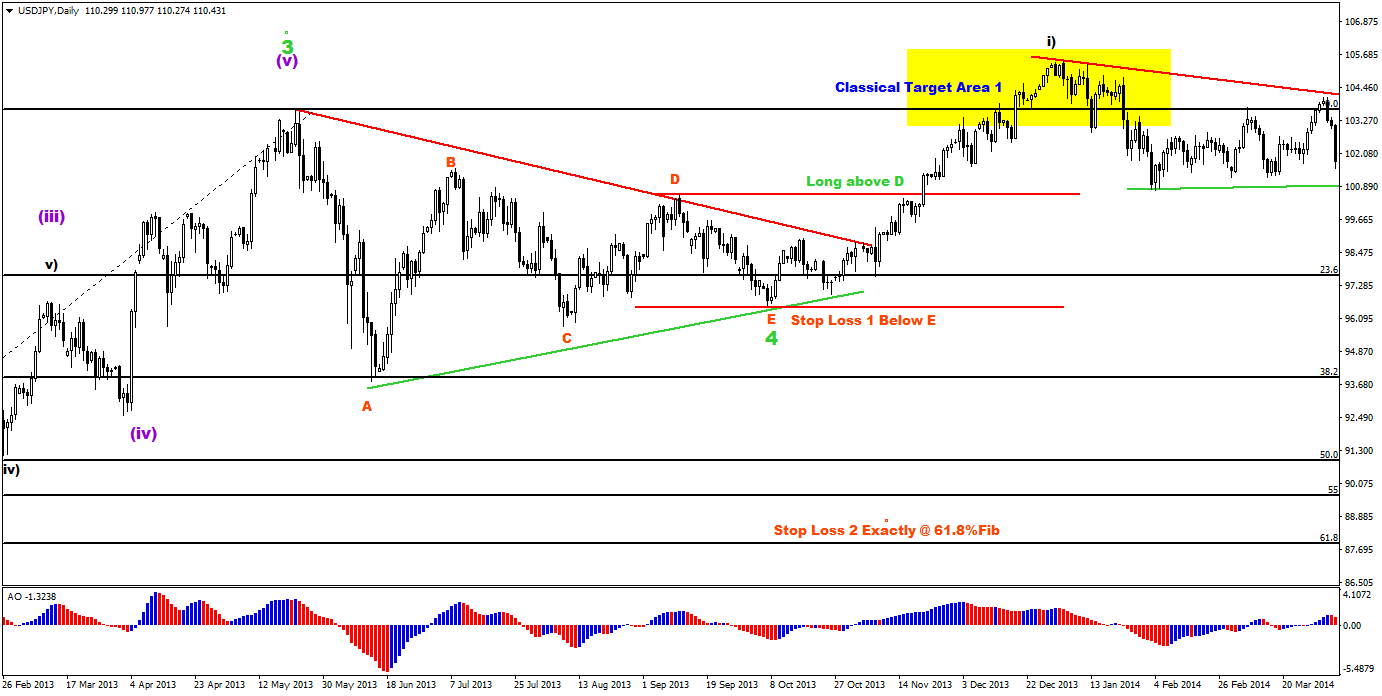
Fig 5: Triangles & Elliott Wave
Next step is the most fun! Finding good targets.
The first target can be the classical target area which is around the previous top. The final targets could be the -27.2% and -61.8% Fibonacci levels of the wave 3 Fib.
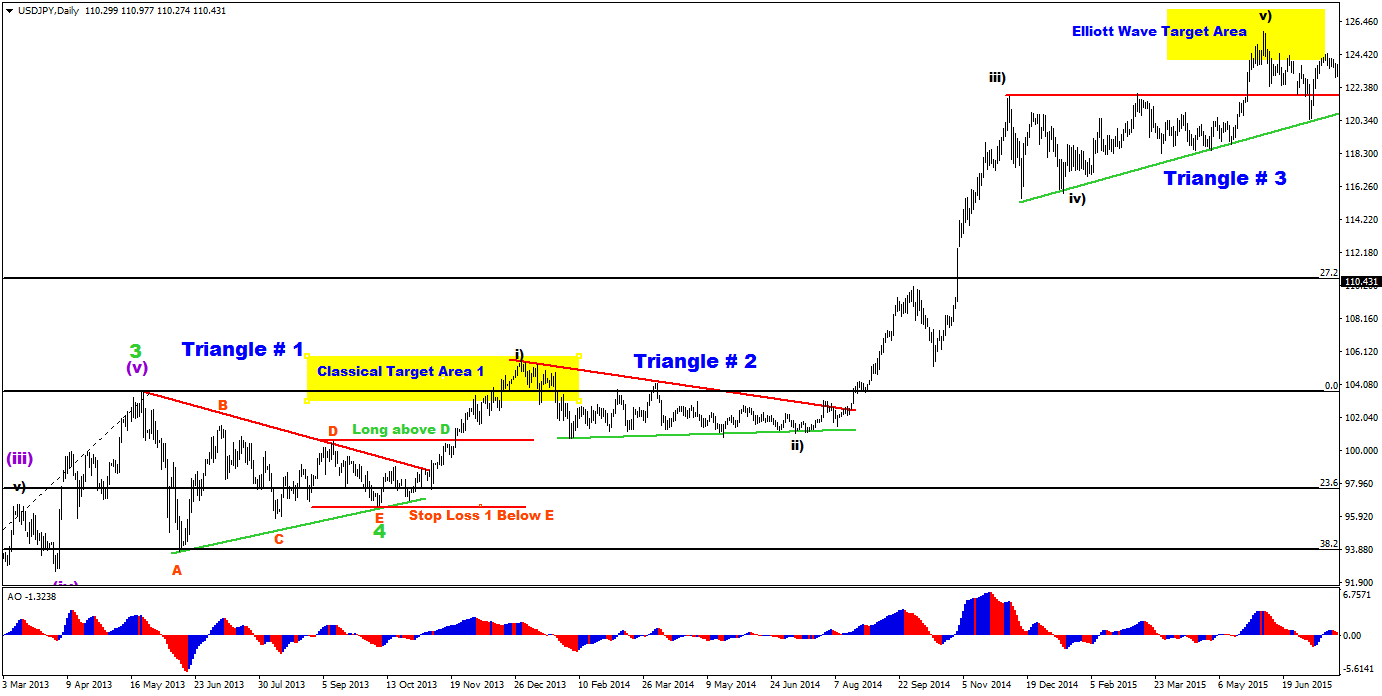
Fig 6: Triangles & Elliott Wave
We hope that this article shows you the value of trading waves and patterns. The ecs.SWAT method is known to make wave trading simple – try it out today.
Many green pips,
Chris Svorcik
More info on our ecs.SWAT course and trading system
Twitter: @EliteCurrenSea
YouTube: Elite CurrenSea


Awsome article thank you very much!
Thank you!