How to Use a “Wave Trend Indicator” for Price Swings & Wave Patterns
Subscribe

Dear Traders,
Did you ever wonder if there is an indicator that helps simplify Elliott Wave analysis? How does a “wave trend indicator” work or is it better to trade waves without it?
The short answer is yes, a wave trend oscillator is a critical tool for analysing and trading waves. This article reveals what is considered the best wave trend indicator or wave trend oscillator.
We also explain how to use indicators for improved price swing recognition and Elliott Wave analysis. Plus we show traders a simple method that drastically improves your accuracy when determining price swings and wave patterns.
By the way, if you become a member today, then we will show you a simple trend strategy by using Moving Averages, Fibonacci, Fractals and the wave indicator in our SWAT (Simple Wave Analysis & Trading) course.
Can Wave Trend Indicators Help with Elliott Wave Theory?
Yes, they can. According Chris Svorcik, our chief wave analyst at Elite CurrenSea, both price action and the oscillator indicator can be of enormous help in understanding the Elliott Wave structure.
Based on our own experience, we highly recommend analysing Elliott waves based on price action in combination with an oscillator. The best indicators are the AO (Awesome Oscillator) and macd.PRO (we explain why later on).
The main benefit of using an oscillator for understanding waves is because it offers a standard method for spotting price swings.
Often traders face a simple yet tough problem: what is the definition of a price swing and wave?
Traders must have a clear and logical system of identifying one price swing because without a rules based approach, traders will misinterpret the chart and always be unsure about their analysis.
In fact, most traders fail in trading, mastering the waves, and trading the waves because they do not use a systematic method for understanding and reading price swings.
With a systematic approach, traders will quickly feel lost in the chart. What price action belongs to which price swing? When does the price swing start and end?
In this article Elite CurrenSea will share its methods (based on our SWAT course) how we use the oscillator for a better understanding, interpretation, analysis, and trade setups based on the wave patterns. In our view, traders improve their the Elliott Wave count with the Awesome Oscillator and/or ecs.MACD – this article explains why.
So now, you might be wondering how do you use the Elliott Wave indicator for analysing and trading waves?
What is the Best Wave Trend Indicator or Wave Trend Oscillator?
Elite CurrenSea uses the Awesome Oscillator (Elliott Wave) as a wave trend indicator – available for free via MetaTrader 4/5 (MT4). The AO (Awesome Oscillator), which is created by the Elliott Wave expert, legendary trader, and Fractal creator Bill Williams, is in our view the best oscillator for analyzing the waves of the Forex, CFD, and other financial markets.
A good second place, however, is reserved for our own proprietary MACD indicator called the macd.PRO. Although there a wide range of wave trend indicators that are mentioned online, the AO and the macd.PRO are two of the most accurate wave trend indicators and wave trend oscillators for the MT4 platform. They are also key indicators for any trend wave strategy. We will now explain why.
Identifying the Correct Price Swing
There are multiple solid methods of applying a rules based approach for identifying the correct price swing. But we will continue our focus on the AO (Awesome Oscillator) and macd.PRO. Once again, both indicators are excellent ave trend oscillators for MT4.
Here are the key factors to analyse:
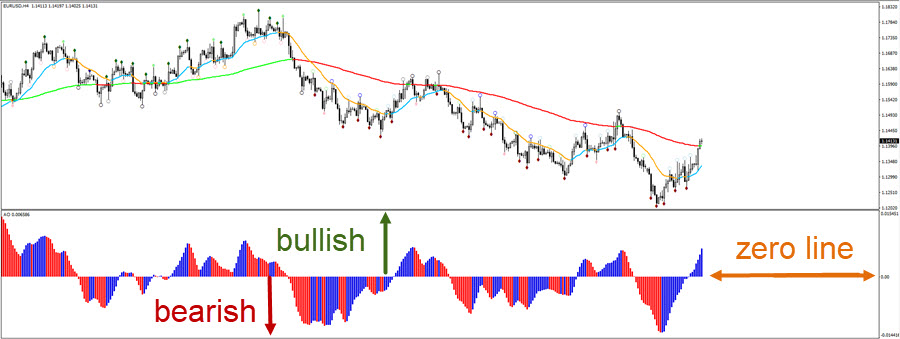
- The zero (0) line: the key point part of the oscillator is the “zero” line. Every time the AO or macd.PRO bars cross the zero line, a new price swing is in process.
- Blue or red bars: blue bars indicate bullishness whereas red bars indicate bearishness.
- Bars versus zero line: now let’s combine the above information:
- Blue bars above the zero line indicates bullish momentum or impulse.
- Red bars above the zero line indicates a bullish correction.
- Red bars below the zero line indicates bearish momentum or impulse.
- Blue bars below the zero line indicates a bullish correction.
With this in mind, we can make the following conclusions:
1. Price is not hitting the zero line recently:
-
- Price is in momentum: when the Awesome Oscillator Elliott Wave bars move away from the zero line.
- Bullish: bars are above the zero line.
- Bearish: bars are below the zero line.
- Price is in a retracement: when the Awesome Oscillator Elliott Wave bars are moving back to the zero line.
- Price is in momentum: when the Awesome Oscillator Elliott Wave bars move away from the zero line.
2. Price is near the zero line:
When the Awesome Oscillator Elliott Wave bars are back at the zero line, price has completed an old price swing and is building a new price swing. This means that it has reached an indecision spot:
-
- Price is in a reversal: if the Awesome Oscillator Elliott Wave bars are moving away from the zero line after recently crossing the zero line.
- Price is in a retracement or range: if the Awesome Oscillator Elliott Wave bars go sideways.
- Price is in a trend continuation: if the Awesome Oscillator Elliott Wave bars continue in the same direction (as the previous swing).
How to Find the Price Swing Using Wave Trend Oscillator MT4
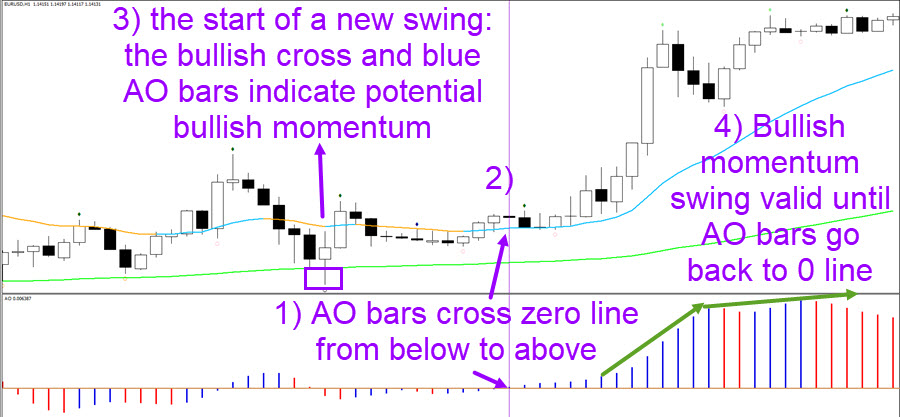
How do you recognize on the price chart what is the correct price swing when analysing the zero line of our wave trend indicator, the Awesome Oscillator Elliott Wave or macd.PRO,?
- As you now know, a new price swing is valid every time the Awesome Oscillator Elliott Wave indicator bar crosses the zero line.
- Once this occurs on the Awesome Oscillator Elliott Wave indicator, traders must analyse the price charts at the same moment as the Awesome Oscillator Elliott Wave bars are crossing the zero line.
- Then look for the most recent top or bottom which is the end of the previous price swing and the start of the new price swing.
As indicated above, the cross of the zero line is key for understanding price swings and wave patterns. Here is an example of how traders can understand the process in more detail.
The above image is an example where we zooming to one spot of the chart. Let’s now show a chart now which shows a larger piece of the price action.

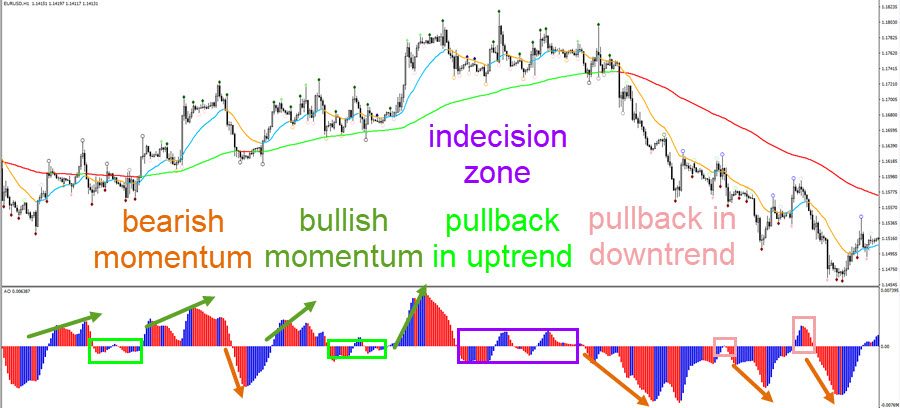
The above chart shows purple arrows, which indicate each time the Awesome Oscillator Elliott Wave bars cross the zero line. Each crossing of that zero line indicates the end of a price swing and wave pattern too.
The purple boxes on the chart indicate the turning spot of each swing whereas the arrows in between the purple boxes show whether the price swing is a:
- Bearish impulse: red arrow
- Bullish impulse: blue arrow
- Bearish correction: green arrow
- Bullish correction: orange arrow
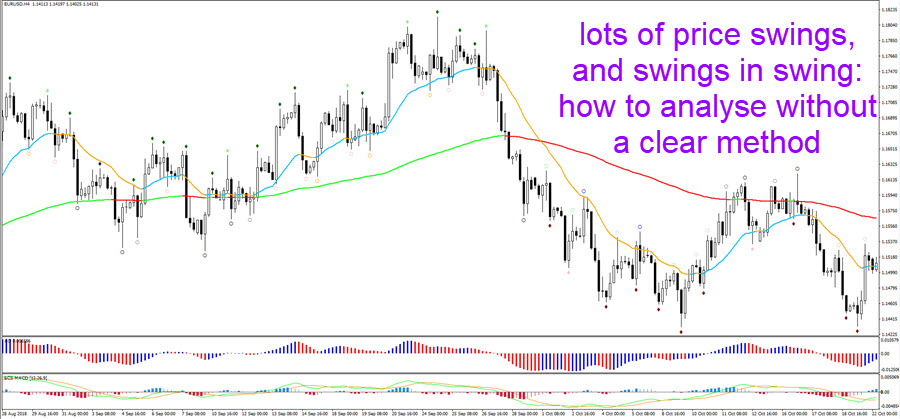
Compare the above chart to a naked chart that you can see here below. Would you be able to achieve the same consistency with the Awesome Oscillator Elliott Wave as without the AO? Would you truly be able to recognise the price swings as quick and with the same consistency?
That is possible for traders who have more experience but is much more difficult for traders that are beginning or intermediate. They are much better by using a rules based approach. All the rules connected to this and much, much more is what we fully explain in our ecs.SWAT methodology, which offers a clear wave trend strategy.
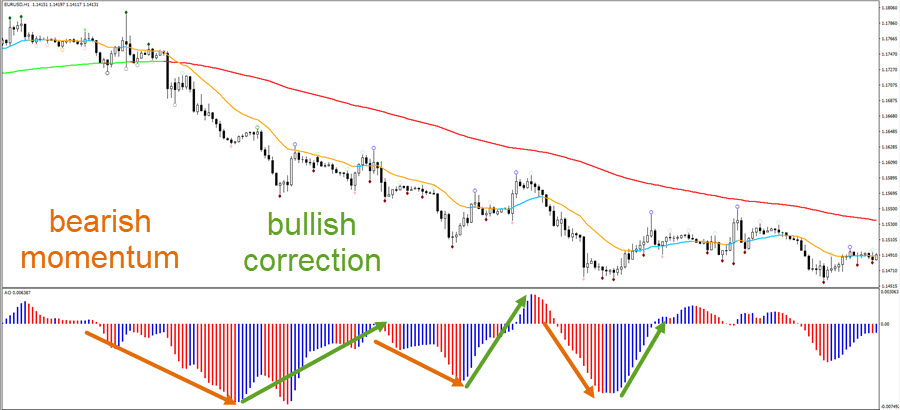
Identifying Momentum & Correction with Wavetrend Oscillator
Now that you know how you can find, measure, and analyse the correct price swing on any chart, we wanted to provide you with more examples on how to identify momentum and correction.
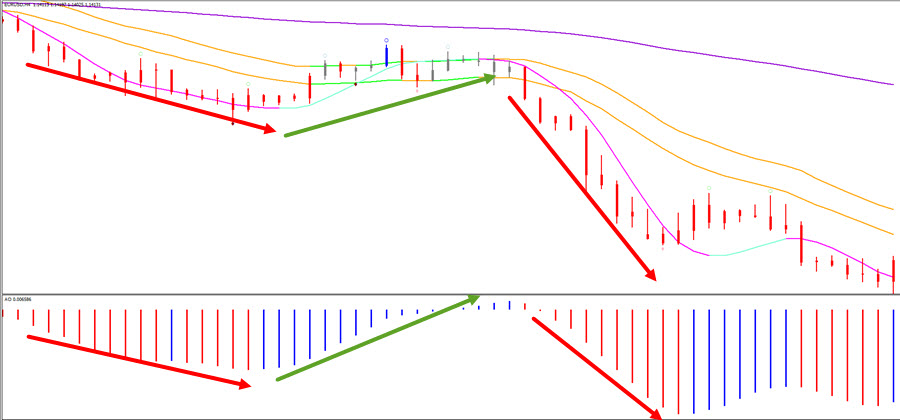
- This chart shows how strong Awesome Oscillator Elliott Wave bars moving away from the zero line.
- As a confirmation on the price chart, you can also see how price is moving away from the moving averages.
- The strong impulse is likely to see a bearish continuation once price makes a pullback, which occurs a little later.
- The Awesome Oscillator Elliott Wave bars go back to the zero line and complete a bullish correction and retracement.
- A strong breakout candle and ecs.SWAT candles start the downtrend again. Strong AO bars again emerge as they move away from the zero line, which signals a bearish continuation as expected.
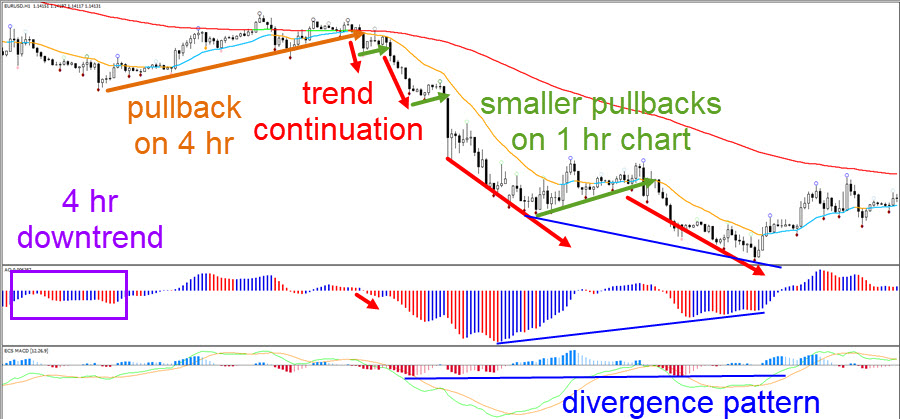
Here is a summary:
- A bigger retracement is taking place on the 1 hour chart because the 4 hour world is making a pullback.
- But we can see early signs of a trend continuation when price is close to the zero line and then falls below it.
- Both price and the AO bars fall dramatically after that before a larger pullback takes place and a final last push which creates a divergence pattern.
Labelling Wave Patterns with Wavetrend Indicator
Once you know how 1) to spot the correct price swing, 2) know its direction (bullish or bearish), and 3) know its behavior (impulsive or corrective), then you are well on your way to becoming an Elliott Wave analyst.
Wave analysis is nothing more or less than analysing price swings from the past and analysing what the current and next price swing is likely to be. Analysing swings is like putting together a puzzle and you are using the pieces from the past to understand what piece might fit next.
Although wave analysis might sound or seem complicated, its complexity is massively reduced when using a wave trend indicator or wave trend oscillator to understand price swings. But keep in mind that knowing how to do wave analysis is not necessary if you trade our ecs.SWAT method because we trade the waves without labeling them and you can do the same.
Although we will not dive into all the facets of wave analysis in this sub paragraph of today’s article, we did want to provide an overview of how the the Awesome Oscillator (AO) works together with wave analysis. Once again, the AO is a great wave trend oscillator for the MT4 and works well for any trend wave strategy.
Wave 1
The AO bars are showing a first stronger push away from the zero line, often into the opposite direction of the previous swing.
Wave 2
A shallow retracement back to the zero line occurs, but the Awesome Oscillator Elliott Wave bars do not go much into the opposite direction.
Wave 3
Strong Awesome Oscillator Elliott Wave bars push away from the zero line. Keep in mind that the wave 3 might become extended and hence you might see several strong pushes away from the zero line. Some of these pushes could all be part of a larger wave 3.
Wave 4
Eventually the strong wave 3 will finish and a larger retracement will take place back to the zero line, which could easily occur on a higher time frame as well because waves 4 are often lengthy.
Wave 5
The last push in the trend. The Awesome Oscillator Elliott Wave bars move away from the 0 line but not as much as the wave 3, which creates divergence because price does often make a higher high but the Awesome Oscillator Elliott Wave does not.

Wave A
The Awesome Oscillator Elliott Wave bars were closer to the zero line usually because the trend is becoming slower. The first counter trend move shows impulse as the AO bars cross the zero line and keep their speed, moving into the opposite direction.
Wave B
A last push with the previous trend but the Awesome Oscillator Elliott Wave bars hardly cross the zero line any more.
Wave C
The larger correction continues as a large push creates a 3rd counter trend wave.

ABCDE triangle
When a triangle or wedge chart pattern takes place, the Awesome Oscillator Elliott Wave bars will be mostly hanging around the zero line.
Benefits of AO and macd.PRO for Trend Wave Strategy
There are many benefits for using the correct price swings:
- Placing the Fibonacci tool on the right swing: the swing is the key concept for placing the Fib on the correct starting and ending spot.
- Knowing if a price swing is still in motion: is the price swing still ongoing.
- Knowing if a price swing has ended and a new one is starting: at one moment the old swing finishes and a new one starts.
- Understanding in more depth how the price swings connect within the Elliott Wave Theory: price swings are in fact that waves that we see on the price chart. Knowing the price swings makes it easier to spot and connect the waves.
- Understanding and spotting chart patterns easier: price swings
- Using all this info for trading decisions: knowing the direction and pace of the price swing helps us focus on the right trades.
Simply said, a rules based approach for price swings is a must to understand the charts in more depth – in general.
In specific, the AO and macd.PRO are both extremely valuable for identifying the correct price swings with a rules based approach.
This in turn allows traders to make more sophisticated, quick, and educated analysis about Fibs, chart patterns, and momentum and correction.
They are equally valuable in determining wave patterns because wave analysis is simply an analysis of price swings. Once you understand price swing, you will understand wave patterns too.
In the field of Elliott Wave analysis both oscillators provide key information about the exact price swing, wave count, and wave pattern outlook. Here are the three major benefits of using the AO or the ecs.MACD as a wave trend indicator:
- Helps identify the correct price swings.
- Indicates and confirms momentum and correction.
- Labels the wave patterns.
Problems Without Using Any Wavetrend Indicator
If you do not use the AO or macd.PRO, the problem occur when applying a discretionary (and not a rules based method based on oscillators) approach to your wave analysis:
- Your analysis will be less accurate: identifying a wave without a wave trend oscillator is difficult and also time consuming. Most traders will not have the required experience to analysis waves without fixed rules.
- There are many waves and waves within waves. What is one price swing or wave? Can you repeat the same logic on each and every chart? In most cases, traders cannot manage this level of consistency.
- You will not have sufficient confidence when trading: although analysing the charts might work out fine, trading your wave analysis with actual capital always requires more confidence.
The key to success in analysing and trading price swings and the Elliott Wave Theory is by applying a systematic way of identifying one single wave.
This can be done via the AO and macd.PRO. Both are excellent wavetrend oscillators and wavetrend indicators.
Our SWAT course explains exactly how to see and trade price swings and waves in a precise method with various trading systems and a clear wave trend strategy. SWAT is an excellent trend wave strategy.
Are There Counter Opinions Against Using the Wavetrend Indicator for Elliott Waves?
But there is a “dispute” among wave analysts and some believe that indicators do not play any significant role. The problem of spotting price swings and waves without any indicator help is that it quickly becomes confusing.
Traders get lost in a sea of options: does this swing belong to this or that swing? This is especially true to beginning and intermediate traders.
By using a wave trend oscillator and moving averages, the trader breaks down the learning process into more doable steps. They can build up experience and translate that into more specific trading ideas.
If traders only look at price action, then the learning curve is much steeper, it is more difficult to gain confidence, and the trade ideas are often more confusing.
Not using the wave trend oscillators at first is similar to driving a Formula 1 car at max speed without any training. The wave trend oscillators give you that well deserved training.
Summary
All in all, the Elliott Wave count with the Awesome Oscillator is a major asset when analysing the charts, price swings, and wave patterns as it helps you:
- Identify the correct price swing:
Use the crossing of the Awesome Oscillator Elliott Wave bars below and above the zero line to know what is the price swing. You then know the start and end of each price swing on the chart as well (see above). You can also use the ecs.MACD. Both indicators work well as a wave trend oscillator for MT4. - Understand the direction of the price swing:
When Awesome Oscillator Elliott Wave bars are above the zero line, this mean that price is either showing bullish momentum or a strong bullish correction which depends on the context of the other price swing. In both cases though, the bulls are in control of the current price swing. Same is true of course when the Awesome Oscillator Elliott Wave bars are below the zero line, which means that the bears are in control. A wave trend oscillator is key for this step. - To understand the behavior (impulse or correction) of the price swing:
Traders can also understand the behavior of the price swing and estimate whether its impulsive or corrective. If price is showing a strong push (momentum / impulse) above the zero line, then a move back to and even below the zero line is often a retracement. But if the Awesome Oscillator Elliott Wave bars are crossing the zero line after a divergence pattern (Awesome Oscillator Elliott Wave bars showing a failure to make a higher high or lower low), then the chance of a reversal is increasing. A trend continuation is often impulsive, a retracement is often corrective whereas a reversal will most likely become impulsive. - To determine the wave patterns of each swing:
Once traders can find the correct price swing, can analyse whether its bullish or bearish, and can understand whether its corrective or impulsive, traders can then use that information to analyse, judge and evaluate the most likely wave patterns.
Analysing wave patterns is nothing more or less than understanding the sequence of price swings.
Mastering wave analysis is now within your reach.
What Next?
If you are interested in learning how to apply a wave trend indicator such as the macd.PRO and AO for analysing and trading waves, then we recommend becoming a SWAT 2.0 member.
You will learn a wave trend strategy and benefit from the educational course with 22+ hours of recording, 74 videos, 10 systems, 3 methods, and dozen plus indicators.
Keep in mind that knowing how to do wave analysis is absolutely unnecessary if you trade our ecs.SWAT method. The beauty of SWAT (Simple Wave Analysis & Trading) is that you can: trade the waves without knowing the waves.
We built our SWAT methodology in such a way that you can benefit from the waves without needing to use the wave patterns themselves.
Join our World of Trading by starting with ecs.SWAT !
Or feel free to also try our automated trading solutions as well.
Good trading,
Chris Svorcik
Elite CurrenSea


Thank you very much for this instructional article. It is truly helpful and you guys are truly an inspiration.
Most welcome! Thank you for reaching out :))
Thank you very much for all the information on swings, waves and the OA!
Thank you for letting us know, happy to hear it 🙂