Introduction to the ECS MACD
Subscribe
Hi Traders,
Did you ever wonder what the MACD actually represents? The beauty of the the MACD is that it’s a trend-following and trend-capturing momentum indicator that shows the relationship between two moving averages of prices.
This article explains the main benefits of the MACD and why its an integral part of the ecs.CAMMACD trading system. Learn how to effectively use the MACD in your analysis and trading.
ecs.MACD Explained
The MACD is an abbreviation of Moving Average Convergence Divergence. Originally created by Gerald Appeal in the late 1970s, the MACD stood the test of time. Original MACD indicator formula is calculated by subtracting the 26-day exponential moving average (EMA) from the 12-day EMA. A nine-day EMA of the MACD, called signal line, is then plotted on top of the MACD, usually marking triggers for buy and sell signals.
Here at Elite CurrenSea we have another updated version of the MACD that is a modification of a so-called 2 Line MACD, which we combine with the CAMMACD modules. The difference is that the default MT4 MACD indicator lacks the fast signal line (instead of showing the fast signal line, it gives you its histogram). We call this indicator ecs.MACD.
For trading, it’s completely irrelevant as long as you use it with other tools that work in conjunction with the MACD itself. When the red and blue MAs cross on the ECS MACD, it is equivalent to the red MA line crossing the green histogram on the default MT4 MACD. There is no lag time with respect to crosses between both indicators, they are timed identically.
ecs.MACD: Trend and Momentum
Trend
Trend is a series of Higher Highs and Higher Lows (uptrend), or a series of thrust and pullback. Very occasionally, the trend can be shadowed by the so-called whipsaws. In that case, the trend is not seen clearly. Because of that, I have been using my own developed MACD indicator that shows trend in the following way:
Higher Time Frames: Monthly, Weekly, Daily
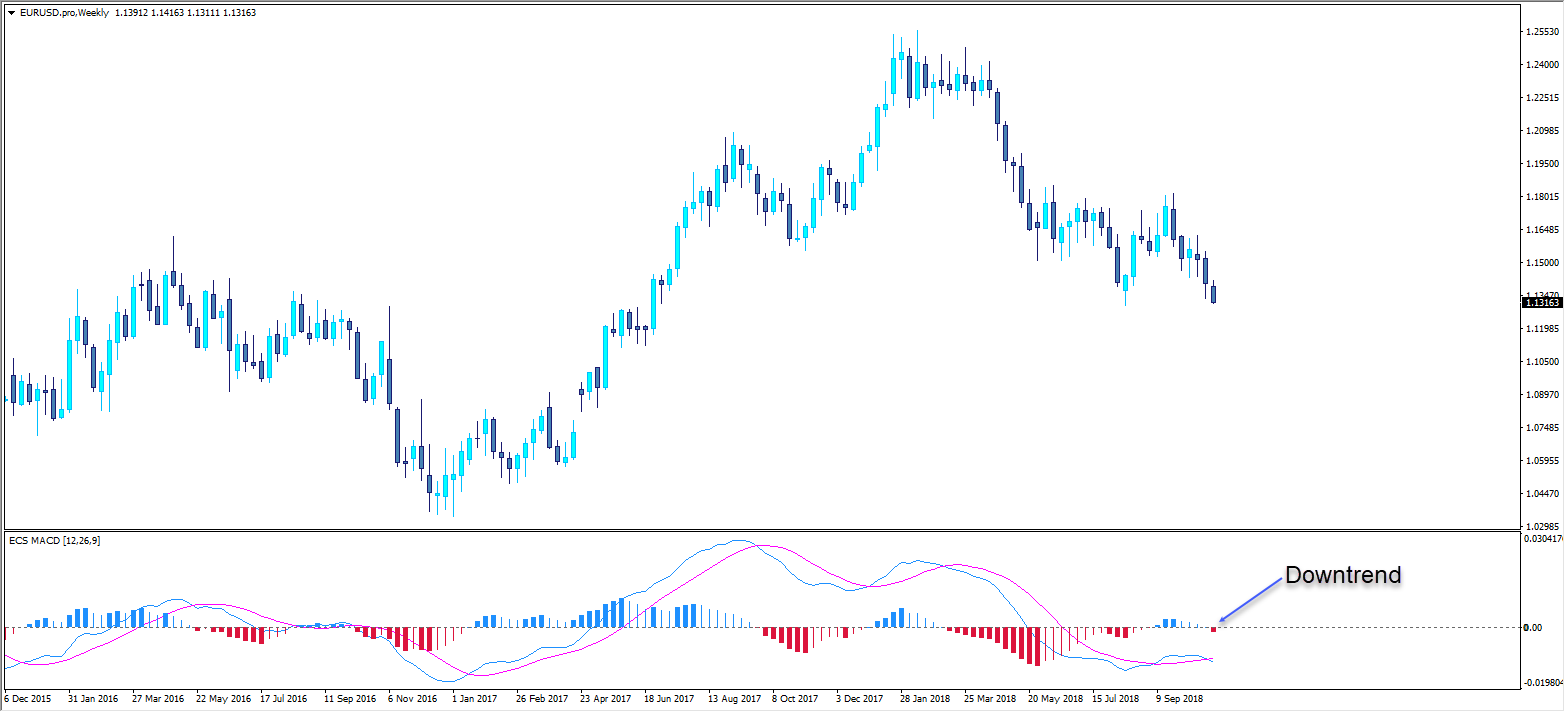
The histogram is thick blue for uptrend or thick red for downtrend. MACD lines don’t need to be above or below 0 line. The only thing which is important here is the histogram bars.
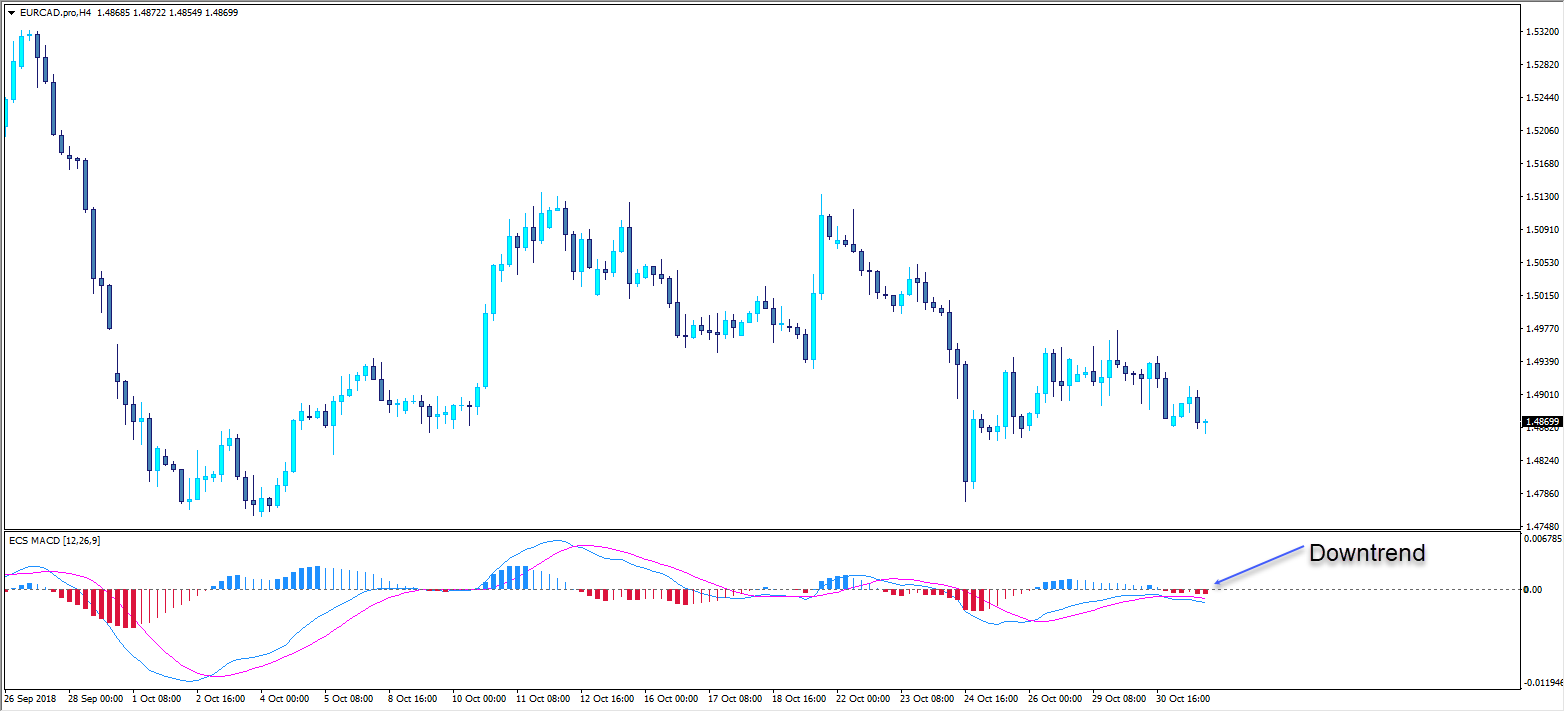
Lower Time Frames: H4, H1, M15
Notice the difference between the higher and lower time frames:
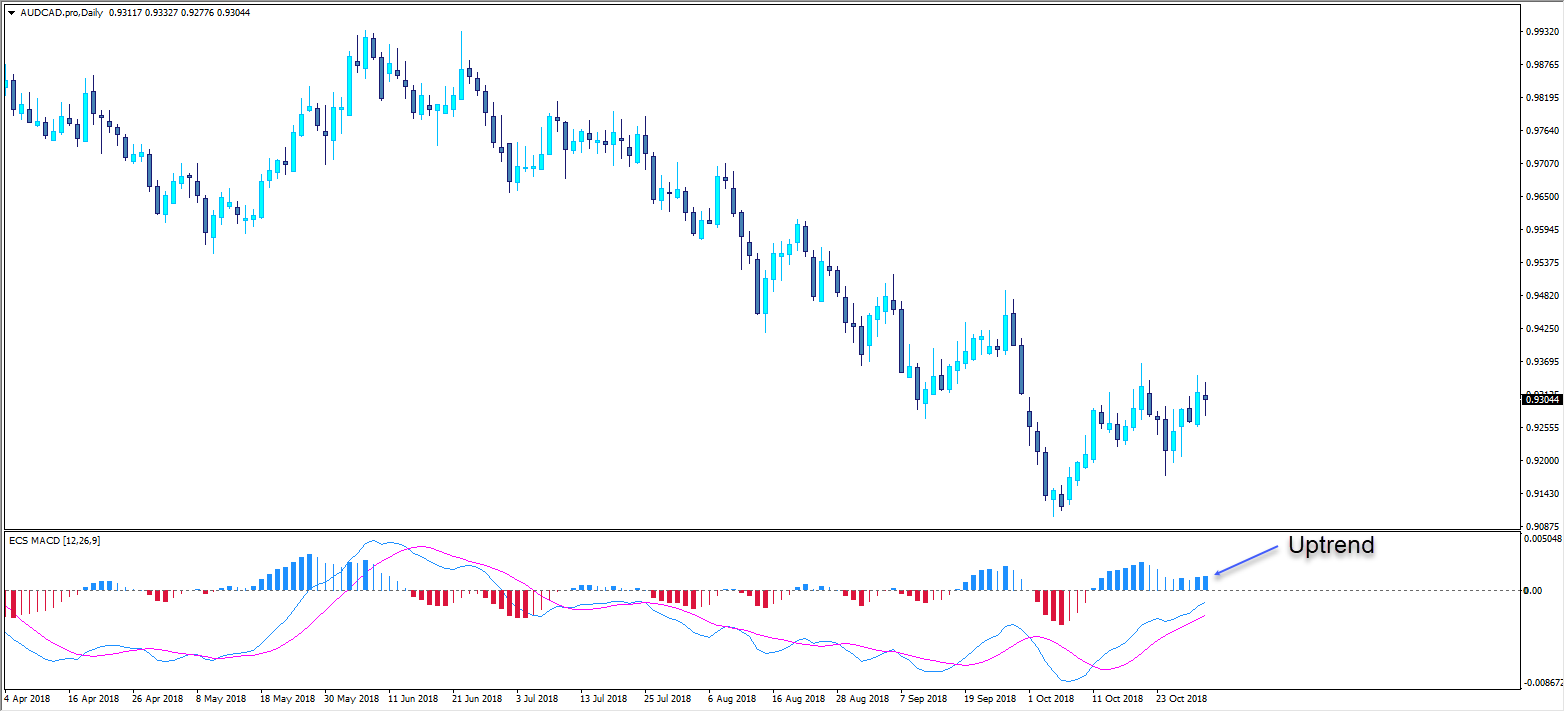
- For uptrend: the histogram is thick blue and the blue MACD line is ABOVE the 0 line for uptrend.
- For downtrend: the histogram is thick red and the blue MACD line is BELOW the 0 line.
So once again, when drilling down to lower time frames, for uptrend MACD needs to be above the 0 line and for downtrend MACD needs to be below the 0 line. For any trend, MACD bars need to be thick.
Downtrend Example
Uptrend Example

ecs.MACD Tips
For entries, some traders would use a momentum time frame, whereas others might want to drill down to a lower time frame and search for an entry.
In the case of the Daily trend, traders might want to look for H4 timeframe retracement. With ecs.MACD retracement is easy to find. When both lines are above 0 line, the retracement is shown as the thick red bar in an uptrend. In downtrend the retracement is shown as thick blue bar while both lines are below the 0 line.
Retracement in Uptrend
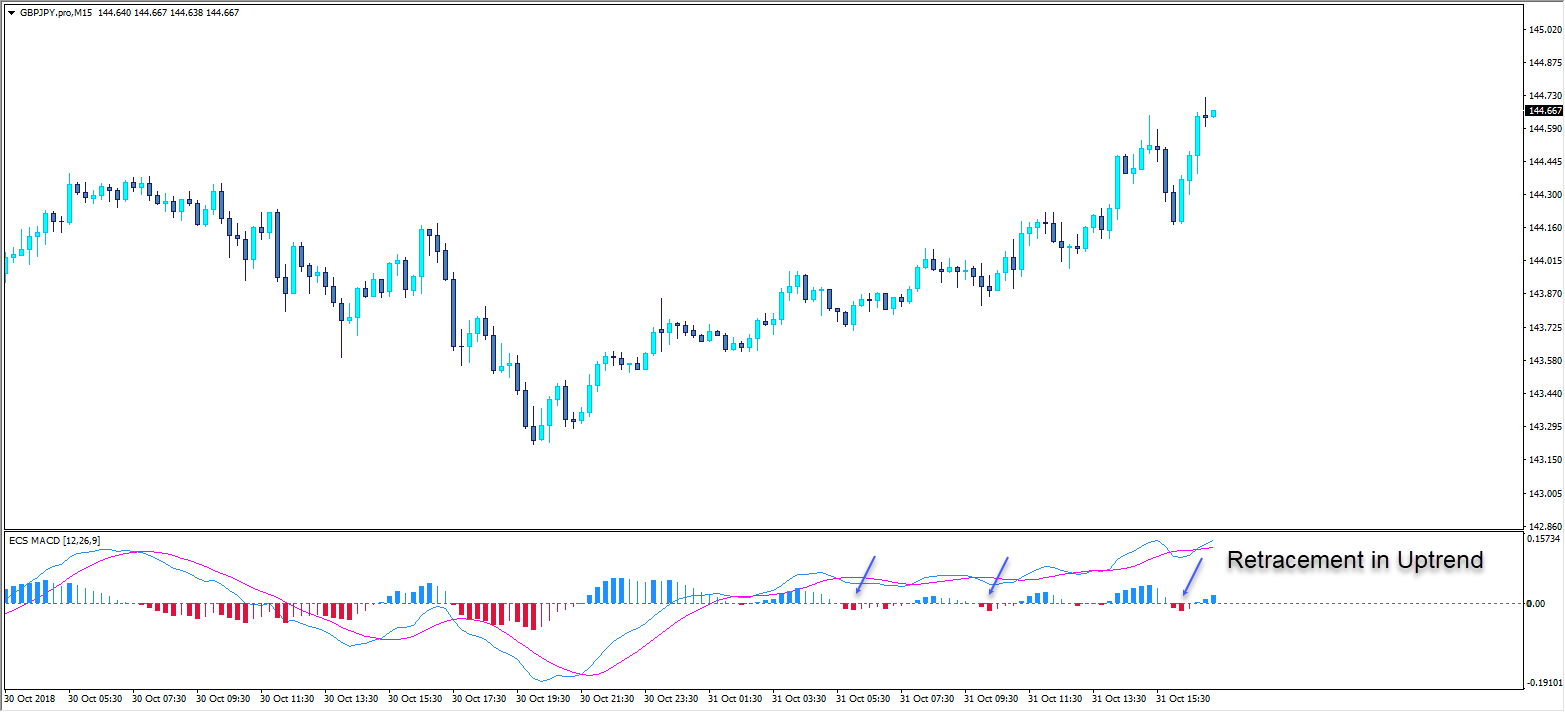
Notice that both lines are above 0 line and the MACD is thick red.
Retracement in Downtrend
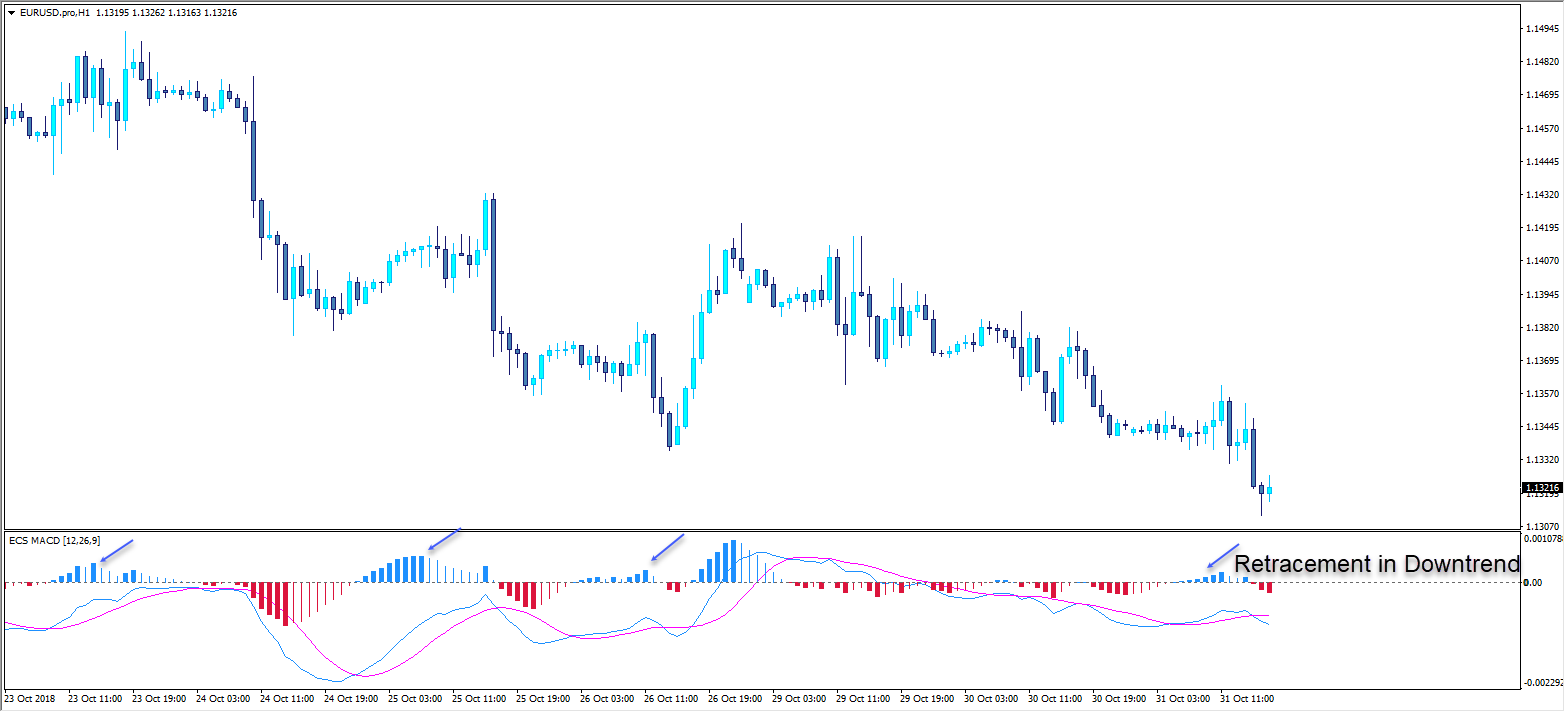
Notice that both lines are below 0 line and the MACD is thick blue.
As the ecs.MACD uses a modified OSMA indicator, traders might want to use the MACD 2 Line indicator as a replacement that can be easily found on the Internet for free. You can obtain ecs.MACD by ordering one of the ecs.CAMMACD trading systems.
One of the first books I read in regards to the famous MACD indicator was William Blau’s Momentum, Direction and Divergence that helped me embrace a lot of principles and incorporate them into the MTF and MACD analysis. But it wouldn’t mean anything if I hadn’t combine it with screening time and trial and error principle.
MTF trading can be a great asset, whereas riding the momentum and trend from higher time frames can prove very fruitful when mastered. Come and join our webinars to see how I trade the price using the MTF approach!
Join our World of Trading by starting with ecs.CAMMACD or ecs.LIVE !
Cheers and safe trading,
Nenad
P.S. Share our passion for trading and learn from our methods and techniques by:
- Joining our premium ecsLIVE channel.
- Subscribing to our ECS YouTube channel with:


Hello Nenad,
Thank you for the very useful explanation of MTF MACD approach. I have two questions so please answer me when you find free time
1.When we look for main bias on Higher Time Frames: Monthly, Weekly, Daily, Is the “candle close” is requirement on that higher timeframe?
2. If we have on weekly chart thick red candle and on the same time on daily chart thick green candle (like we are having now on GBP/USD)..what TF we should consider-weekly or daily for main bias,trend? And in accordance to that, which TF should be our entry daily or h4?
Best Regards,Sasa
Hi Sasa,
Thanks for your question. I am glad that you like the MTF MACD.
1. Yes we need a candle close. Absolutely.
2. If the weekly is thick red color, then daily can be green and can cross into a thin green only if both lines are below the 0 line. In that case, the entry is made on Daily TF.
Hope it helped 🙂
Have a nice day,
Nenad