Learn 6 Methods How to Determine Price Swings
Subscribe
Dear Traders,
Are you unsure how to find price swings on the chart? You are certainly not the only one. In fact, most traders struggle with finding the best price swing when analysing Forex & CFD markets – certainly beginners and even intermediate and advanced traders.
Identifying and determining the correct price swings is critical for analysing and trading charts because of its integral role in understanding chart patterns, placing the Fibonacci tool, and seeing the flow of price.
This article explains our 6 best methods for finding the best and correct price swing. Enjoy and please leave a comment if you think that the article helped you or if you have any questions.
Why Are Price Swings Important?
Price swings are crucial because of these eight reasons:
- It allows traders to understand which price swing they are currently trading.
- It explains what the expect from the current swing in terms of movement and volatility (impulse versus correction).
- It indicates what the direction of the next price swing could be.
- It also shows whether the next price swing will be corrective or impulsive.
- Traders can do wave analysis and understand wave patterns based on price swings, which are the building blocks of swings.
- Traders can use the Fibonacci tool with more accuracy and precision.
- Traders are better able to estimate the time aspect and expected length of a trade setup.
- Traders can identify patterns quicker and easier.
Traders must have a clear and logical system of identifying one price swing because without a rules based approach, traders will misinterpret the chart and always be unsure about their analysis. In fact, most traders fail in trading, mastering the waves, and trading the waves because they do not use a systematic method for understanding and reading price swings.
Based on above info, traders can make better decisions about their trades, such as skipping setups, managing open trades, and entering trade setups. Price swings are not the only factor for trading decisions, of course, but certainly play a key role in our trading and also our technical and wave analysis.
When you are able to identify price swings, then we have a significant edge over a larger group of traders who are not aware of price swings, price patterns, impulse and correction.
All in all, it is very important to use a systematic approach for spotting price swings. Traders need to know the start and end of such swings.
Identifying Price Swings
The ecs.SWAT method uses six distinct approaches to find and identify the correct AND best price swings:
- Time patterns
- HMA moving average
- Wave patterns
- Momentum and correction
- AO and ecs.MACD
Be aware that all six methods could provide different price swings because in some cases, multiple swings could actually be equally logical. It is up to the trader to choose the price swing that makes the most sense but the mentioned methods will help a lot.
Also please note that one method is not better than the other. All of them are useful and traders can analyse and compare multiple methods before making a final decision about which price swings are visible on the chart.
ecs.Fractal Indicator
The fractal indicator helps traders find key support and resistance and potential turning spots on the chart. Traders can either use the standard fractal indicator on their platform or use the ECS fractal indicator for the MetaTrader4 platform. Each fractal indicator, just like the HMA moving average, are automatically plotted on the chart.
Here are the details:
- If price is moving fast into one direction then no fractals will appear, which is an impulsive price swing.
- If many support and resistance fractals appear, then price is building corrective price swing(s) because price is turning up and down – hence it is creating the fractals.
A trader can use the points from one fractal to the next fractal as a price swing. The price action between a support and a resistance fractal could be considered as a separate price swing. If there are two fractals on the same side (either at support or resistance), then it is best to use the fractal that provides the longest price swing. Simply said, all price action between one support and one resistance fractal is considered a price swing.
Here below we added an image. All the purple boxes and arrows have been added to indicate the start and end of each price swing. Each arrow is one price swing. The orange box represents fractals that are not used for a price swing because there are 2x support or resistance fractals present. As mentioned above, a larger price swing is chosen in this case.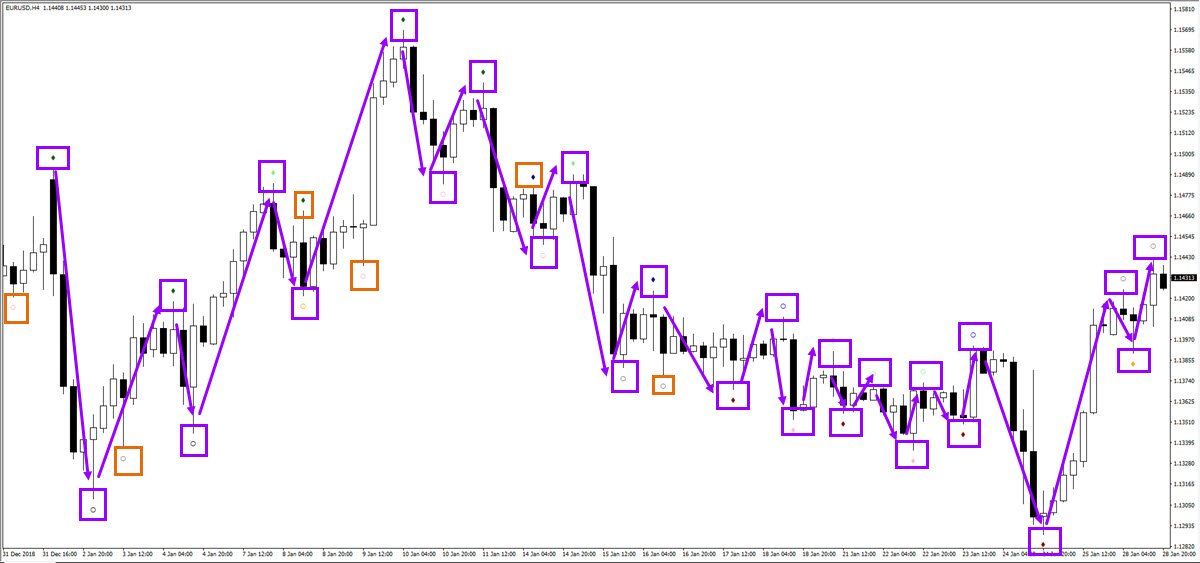
For more information about the fractal indicator, check out the below videos as well.
Learn why the fractal indicator is a must for traders:
And the second vide, which is a guide to the ECS fractal indicator:
Time Patterns and Zigzag Pattern
Time patterns are already visible when using the ECS fractal indicator but they deserve their own paragraph for determining swings. Time patterns in fact are a key part of the pattern family (but that’s a story for another article) but explaining the entire concept here is asking too much.
For the moment, it’s best to use automated tools that represent time patterns by using a fractal indicator (with value 5 rather than 2 if you can change it in your trading platform) or the zigzag indicator with settings 10-5-3 (depth-deviation-backstep) for finding intermediate price swings on the the chart that closely reflect the idea used with time patterns.
Let’s first start with a fractal indicator value of 5 (if your platform allows you to change the fractal value, which not always the case). What does that mean? Let’s explain:
- A candle will either make a higher high or lower high and lower low or higher low when you compare the current to the previous candle.
- A higher high and lower low confirm a trend (new high confirms uptrend and new low confirms downtrend).
- When price shows multiple higher highs or lower lows, there is strong impulsive price action taking place, which is one price swing.
- The impulsive price swing is considered to be over once 5 to 6 candles fail to break the last high or low.
- Then a price swing can be marked as completed and a new price swing is starting.
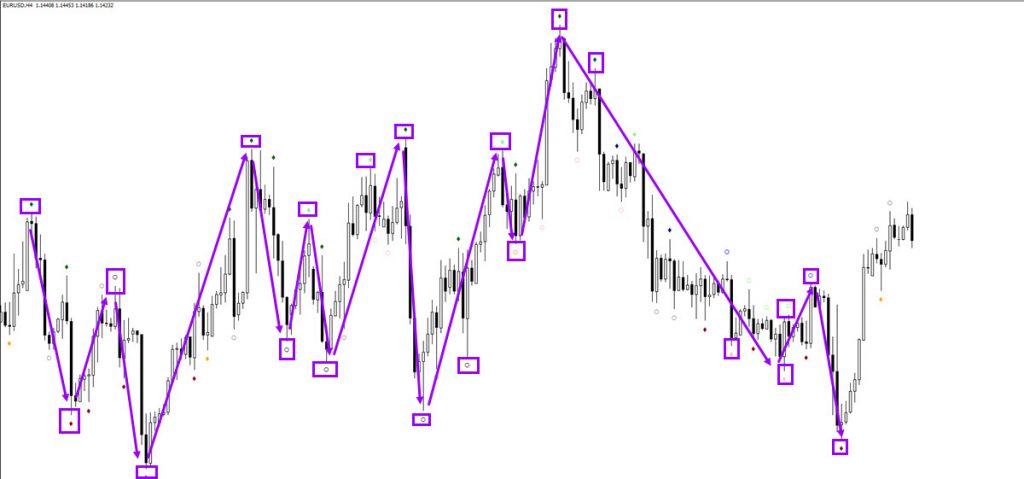

All of these purple boxes indicate a high or low that is higher or lower than 5 candles to the left and 5 candles to the right. All of the purple boxes are also a fractal but as you can see from the image, there are many fractals that did not qualify when using a setting of 5 candles. All the purples arrows indicate a price swing.
The image below shows the price swings that are valid for the zigzag indicator. Some of the price swings are similar to the time pattern ones, but there are a couple or price swings that are actually excluded as well.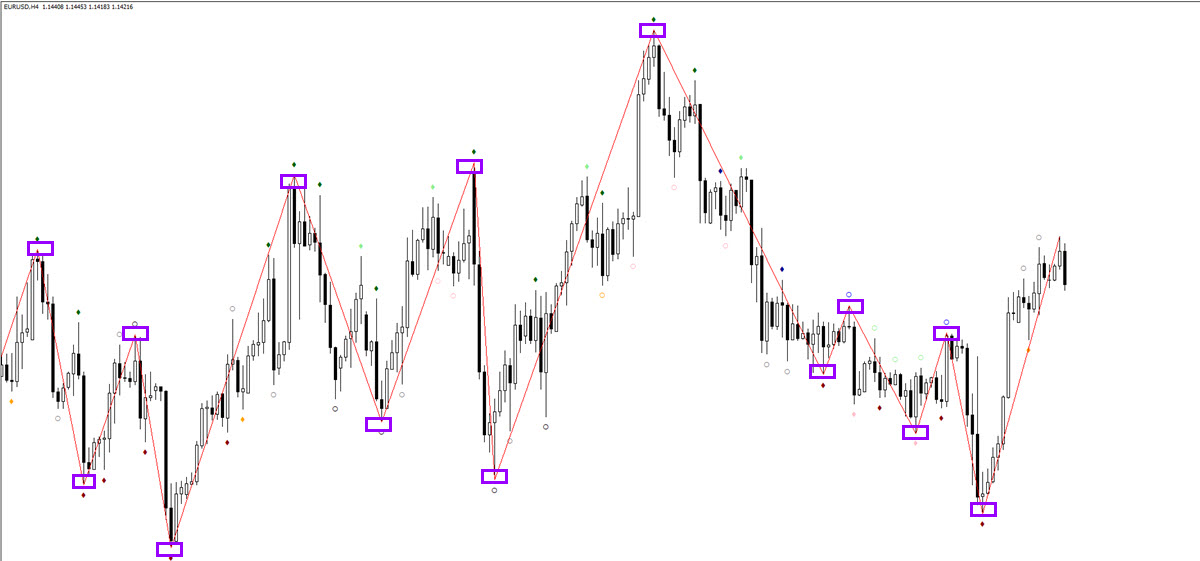
HMA Moving Average
The HMA moving average (setting 20) helps identify what is momentum and what is correction. A switch from bearish to bullish and vice versa often is a warning signal that a swing might be completed. The HMA is a fully automated indicator and hence removes any need for discretionary decisions.
Candles that are moving around the HMA are often periods of correction.The HMA angle will frequently switch from up to down and down to up and when price is in a range whereas a trend will create a sustained HMA angle for a longer period of time.
Another perspective to consider is the candlesticks versus the HMA. When the candle is fully above or below the HMA, then this often indicates a decent or strong momentum.
The image below shows how price is in a range and builds several swings up and down within the range before moving down lower with a strong impulse. The HMA stays bearish until there is a small pullback before continuing lower again with a bearish HMA. Each HMA change can be considered a completed swing.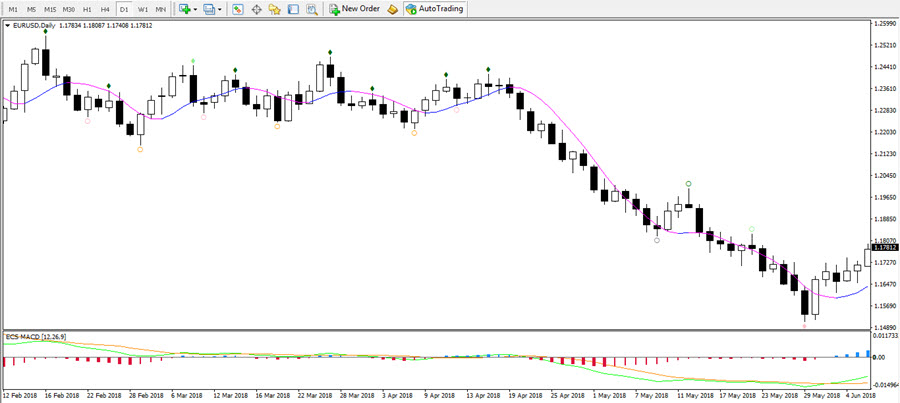
Price action at the top is corrective, the price drop is impulsive.
Wave Patterns
Knowing the Elliott Wave Theory helps you identify price swings too. When price is building a specific wave (1, 2, 3, 4, 5, A, B, C, D, E, W, X, or Y), it will help traders understand what can be considered one full price swing. A wave 1 for instance is clearly a separate swing from a wave 2. An ABC correction too has 3 swings.
For understanding wave analysis in a deeper context, visit our ecs.SWAT method or check out this Ultimate FIbonacci and Wave guide.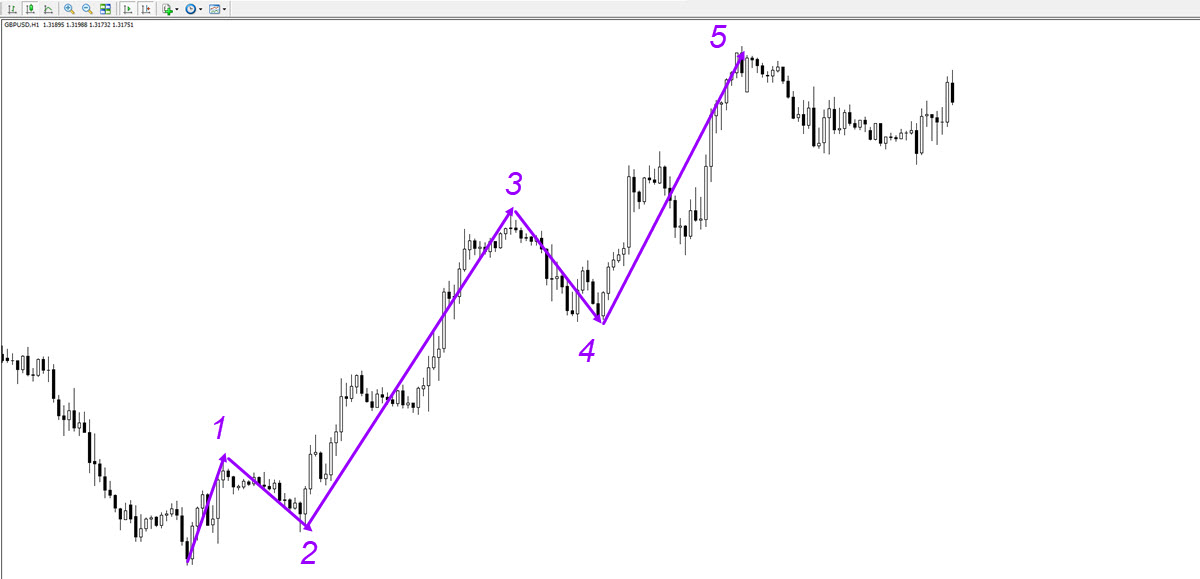
The moving averages can help with identifying the correct wave patterns (see image below). As you can see the waves 2 and 4 dipped below the moving average zone. More information on this can be found, once again, in the ecs.SWAT method.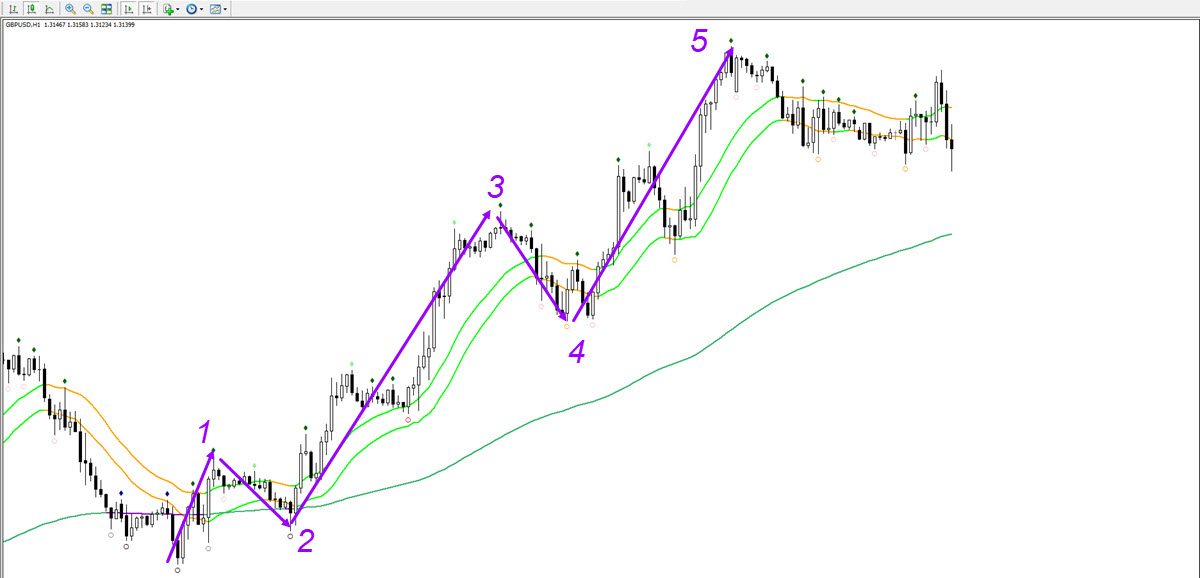
Awesome Oscillator or ecs.MACD
Elite CurrenSea uses the Awesome Oscillator or our premium and proprietary ecs.MACD indicator as a swing and wave trend indicator.
Read this article for a full overview how to use the AO and ecs.MACD for swings.
Momentum and Correction
Elite CurrenSea has already explained the full detail of how to read impulsive and corrective price action in a previous article.
Read this article for a full overview how to use impulse and correction for swings..
Make sure to stayed tuned in to our blog for all of the latest updates!
Join ecs.LIVE for our latest and daily trade setups and live analysis.
Good trading,
Chris Svorcik


Leave a Reply