Best Divergence Patterns and Why All Traders Must Apply Them
Many traders are either unaware of the importance of divergence or unable to accurately apply the divergence concept with an Oscillator indicator. This article will address this gap in divergence knowledge:
- Understand the difference between reading the trend and the oscillator.
- Understand how to use divergence indicator for identifying reversals.
- Implement a divergence indicator strategy to enter the trade.
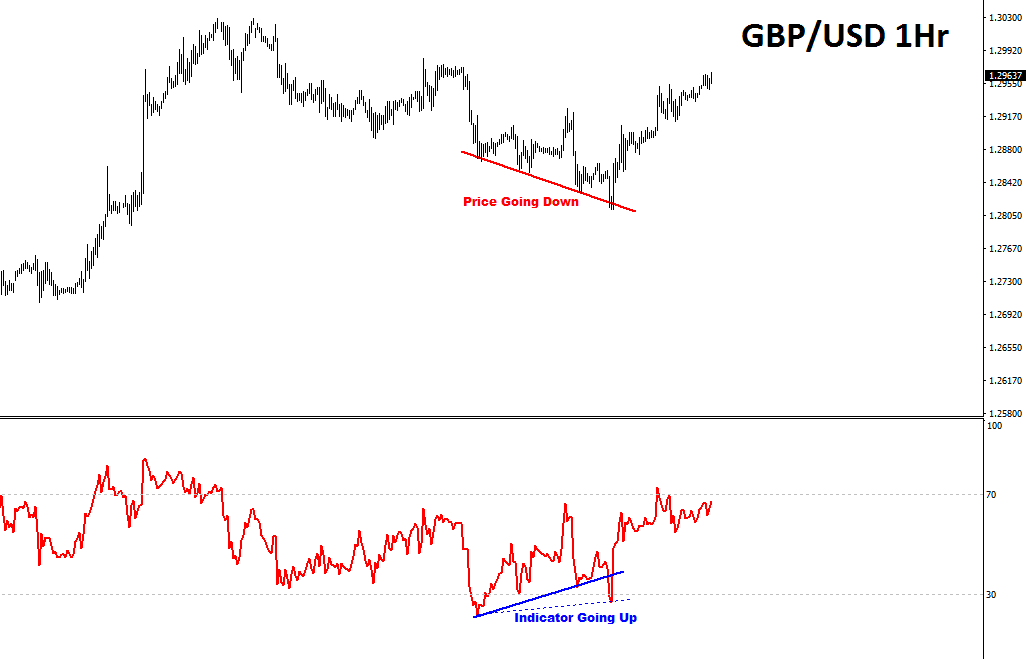
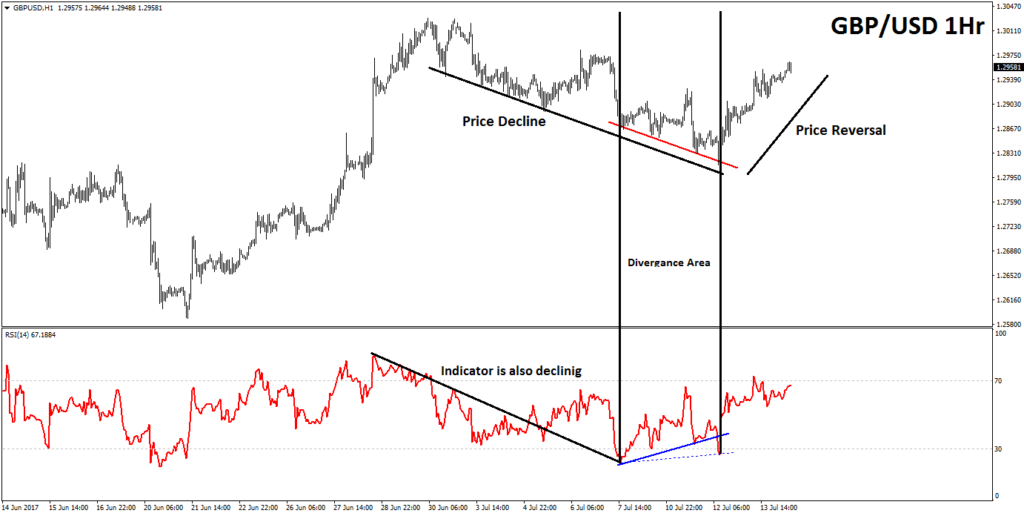
Fig1: Indicator Divergence.
What is divergence?
Simply said, the word divergence means “separate”. Usually the price of an instrument and indicator follow the same path and direction. This is when the oscillator such as the macd.PRO confirms the trend and traders can expect the trend to continue.
But at a certain moment, the path of the macd.PRO and price divert from each other. This is when the divergence indicator pattern kicks in and it makes the trend weaker. Once divergence appears, there is a higher chance of a reversal, especially if divergence appears on a higher time frame, there is multiple divergence on one chart or multiple divergence on multiple time frames.
The best indicator for divergence patterns is the Awesome Oscillator (Chris’s favorite), but there are also others like macd.PRO (Nenad’s favorite), the RSI, CCI, or stochastic.
In this analysis we will be using RSI as the oscillator indicator. In the 1Hr chart below, GBP/USD is building a bearish channel (black line). However, after price builds multiple lower lows, the angle of price and the indicator divert from each other.
During the divergence indicator pattern, price is still continuing with its decline but the RSI shows weakness. It changes its path and starts going up. To analyse the true direction, we identify that price is showing lower lows and whereas the RSI indicates higher lows.

Fig2: Indicator Divergence.
Implementing a Divergence indicator Strategy:
There are many ways to use indicator divergence in trading strategies. In this article we are covering it with Elliot Wave. Indicator and macd.PRO divergence is normally found at:
- End of wave 4
- End of wave 5
- Start of wave 3
- Sometimes at the end of wave C or Y
In the chart below there is an example of divergence with wave 4:
- The divergence is found at the end of wave 4.
- Traders can look for the possible strong support zone.
- The 38.2-50-61.8% Fib levels are strong support zone for the start of wave 5.
- The Fib retracement tool is drawn from start of wave 3 (blue) to end of wave 3 (blue) – as shown in the chart below.
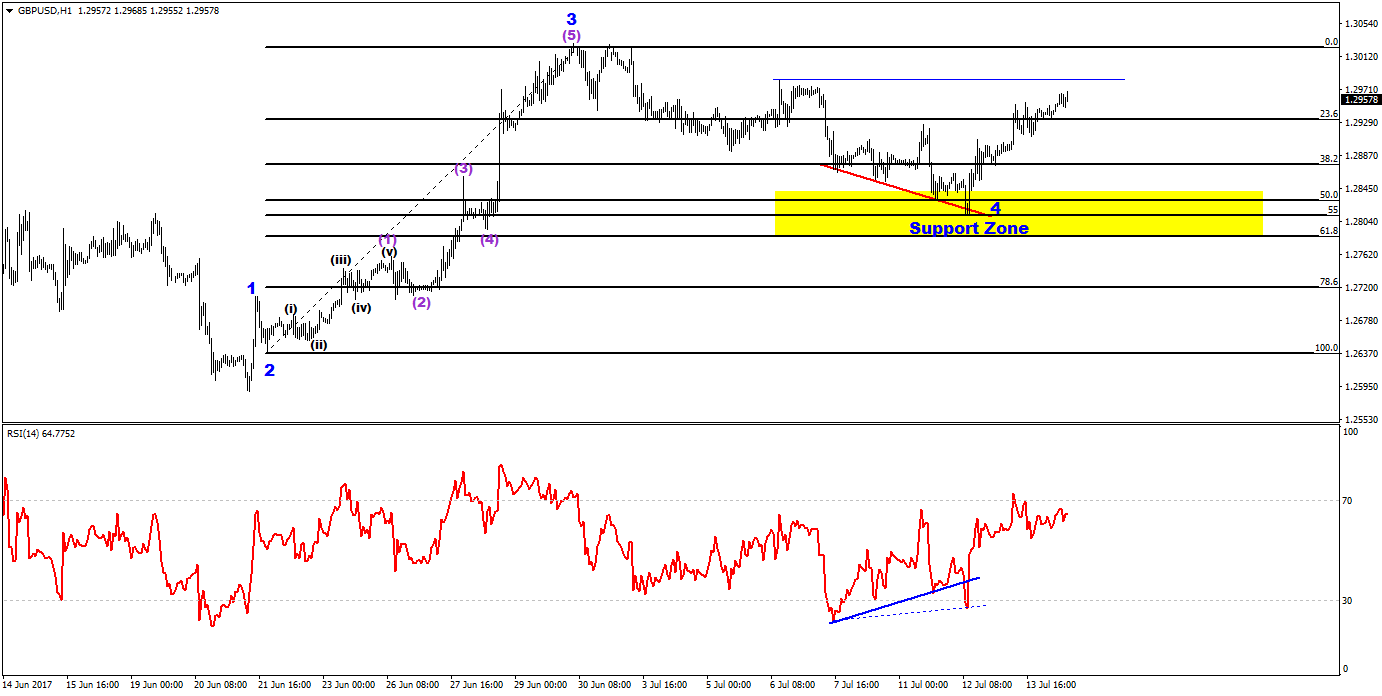
Fig3: divergence at end of wave 4.
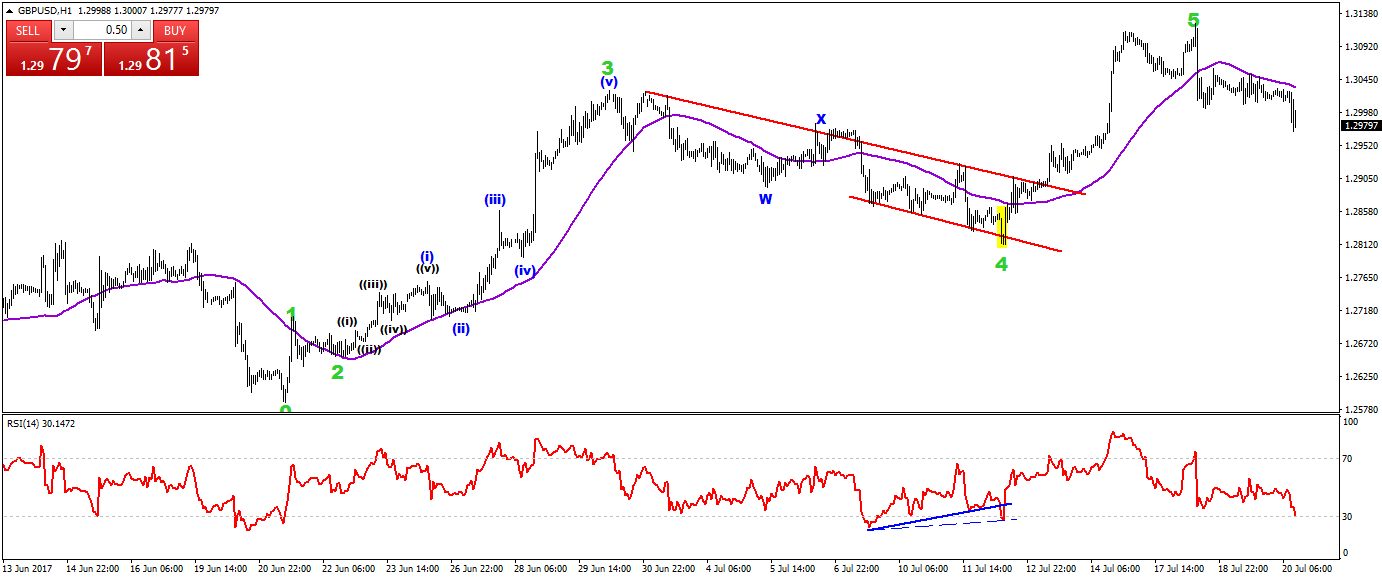
Fig4: Divergence leads to the end of the bearishness and renewed bullish continuation.
Conclusion
Divergence patterns indicate that a reversal is coming soon and becoming more likely but this is not an instant change. The more divergence there is visible, the more likely a reversal does become. Here are some guidelines:
- The entry can not be taken on the basis of divergence indicator alone.
- It’s best if a trader mixes the divergence indicator pattern with their strategy.
- Fibonacci retracement tool, Elliott wave count and indicator divergence altogether make a very power trading strategy for traders.
You can tap into this approach foregoing multiple complexities with SWAT 2.0 – an award-winning system that combines a comprehensive methodology (12h+ video content) that covers Divergence Trading as well as pro indicators and tools (14+).
Follow us:
Twitter: @elitecurrensea
Youtube: Elite CurrenSea


How many can you spot with all 3 confirmation in a week.
Hi Robel, that is difficult to say. If you look at more instruments, currency pairs, and time frames, then you will be able to find more divergence patterns for sure.