Master Guide on CandleStick Patterns

Dear Traders,
As you probably have noticed, traders can analyse the charts in a much deeper way when using candlesticks and candle patterns. The main benefit is that the information from candles is instant and without any lag, such as most indicators.
This article will offer a master guide on candlestick patterns. It includes an explanation how to read candlesticks but also a full overview of the main candlestick patterns and how to interpret them. Candlesticks and their patterns are a main aspect of both trading systems ecs.SWAT and ecs.CAMMACD.
Candles explained
Candlestick patterns are one of the core methods of price action trading. According to Steve Nison, candlestick charting first appeared sometime after 1850. The credit for candlestick development and charting goes to a legendary rice trader named Homma from the town of Sakata, Japan. There is a high probability that his original ideas were modified and filtered over time, eventually evolving into candlestick trading we use today.
Candlesticks provide a wide range of visual hints and thanks to them we can understand price action trading in a much easier way. Time frame trading with Japanese candlestick charts also allows traders to grasp market sentiment. Thanks to Steve Nison and a rice trader Homma, candlestick charts offer a much deeper depth of information than traditional bar charts.
Candlestick Basics
The candlestick is either bullish or bearish:
- A price closing higher than where it opened will produce a white candle by default – bullish.
- A price closing lower than where it opened makes a black candle by default – bearish.
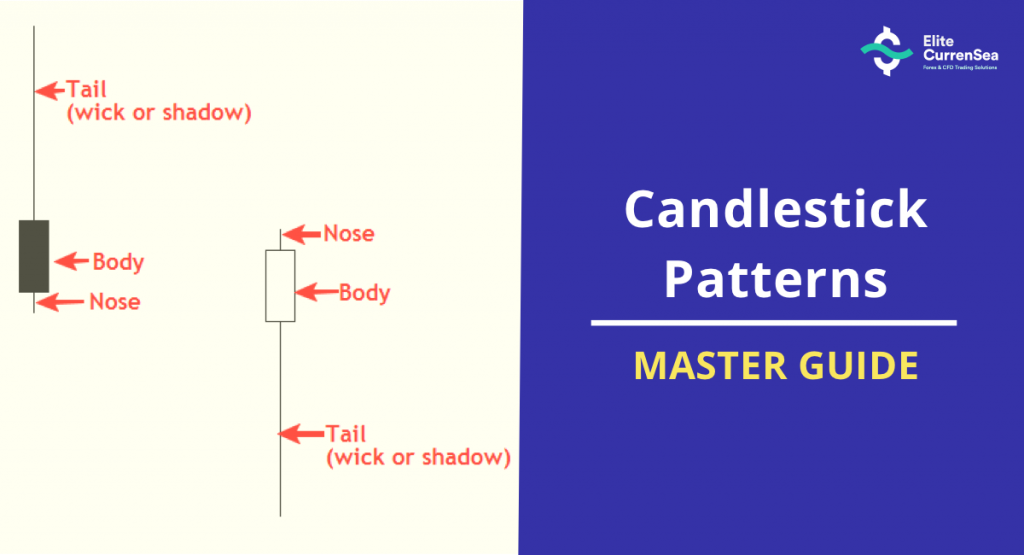
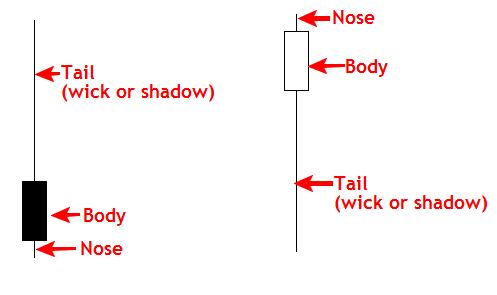
The candle consists of a body, nose, and the tail (wick or a shadow):
- The boxes that are formed by price action are called “the body”.
- The extremes of the daily price movement, represented by lines extending from the body, are called “shadow, tails or wicks”.
- A small part of the candle that is left behind is called “the nose”.
A price closing where it opened or very close to where it opened is called a “doji”. You don’t need to memorise names and descriptions of the candlesticks because it is not needed for successful trading. Nevertheless, it is helpful for any price action trader.
One of the most used price candles is the so called “Pin Bar”. Pin Bars effectively indicate current buyers and sellers. If the tail is longer than the body, then it’s a strong signal that the price might turn.
Correlation between the Open and the Close
The colour of the body in the candle tells us whether it is a positive or negative candle session. In an uptrend or bullish market, the buying often happens at the open price. As the price rises, a white candle is formed. The length, or the distance, between the open and the close reflects the dominance of the bulls. But keep in mind the character of the candle is never fully known until the candle closes.
In contrast, during a bearish market, a dark body candle is created, which means sellers are entering the market on the open and selling the price lower to the close. But once again, only when the candles closes will a trader be sure if it’s a bearish or bullish candle.
Candlestick charts provide great insights into the market dynamics based on the shape and colour of the candle’s body when comparing it to previous candles.
Shadows and Correlation to the Body of the Candle
The wick length can represent a price low and/or high when comparing it with an open or close price from the real body of the candle. This may provide insights on the market’s rejection for a resistance or support price level.
The longer the tail, wick or shadow as they are often called, the more likely it indicates a trend reversal because demand is increasing or supply is reducing. A wick at the bottom of the candle could indicate the end of the downtrend for instance.
Conversely, tails, wicks or shadows at the top of up-trending real candle bodies, may indicate that demand is slowing or supply is increasing. Again, a large shadow, relative to the real body, may signify a stronger reversal, with the strongest being when a pin bar is formed.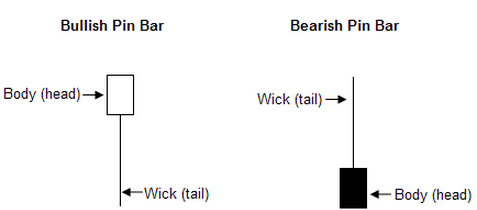
Now that we covered the basics, it’s time to discuss the candlestick patterns. In some cases one specific candlestick can also be a candlestick pattern but other times you need to see a group of candles display a certain pattern.
The next parts will explain bearish and bullish candlestick patterns. We also divided the article in reversal and continuation candlestick patterns, which means that there are 4 parts:
- Bearish reversal candlestick patterns
- Bearish continuation candlestick patterns
- Bullish reversal candlestick patterns
- Bullish continuation candlestick patterns
Let’s first start with the bearish ones.
Bearish Reversal Candlestick Patterns
3 Black Crows
The number of candles in the configuration – 3
- The market is characterised by an uptrend.
- Three consecutive normal or long black candlesticks are seen in the chart.
- Each candlestick opens within the body of the previous candle.
- Candlesticks progressively close at new lows, below the preceding candle.
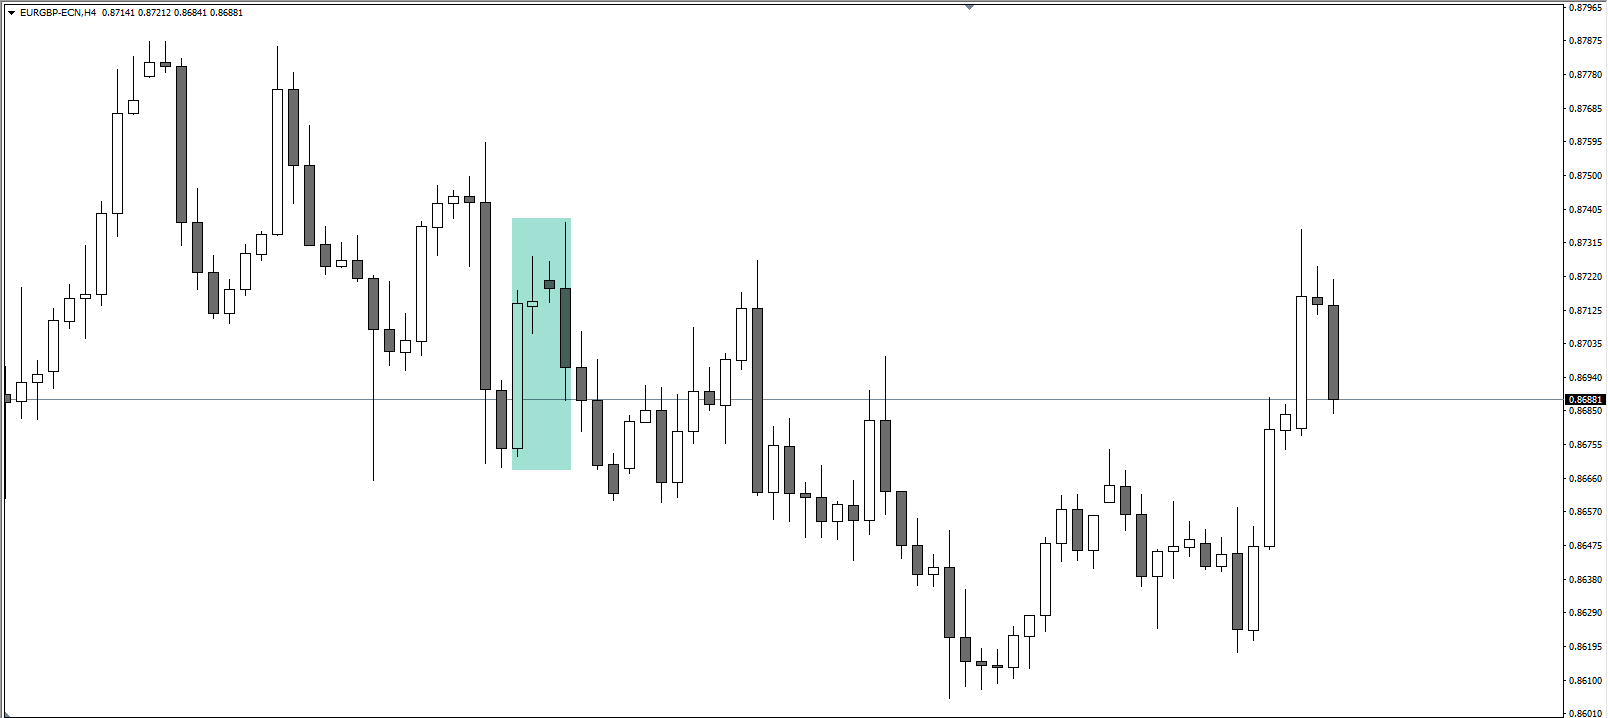
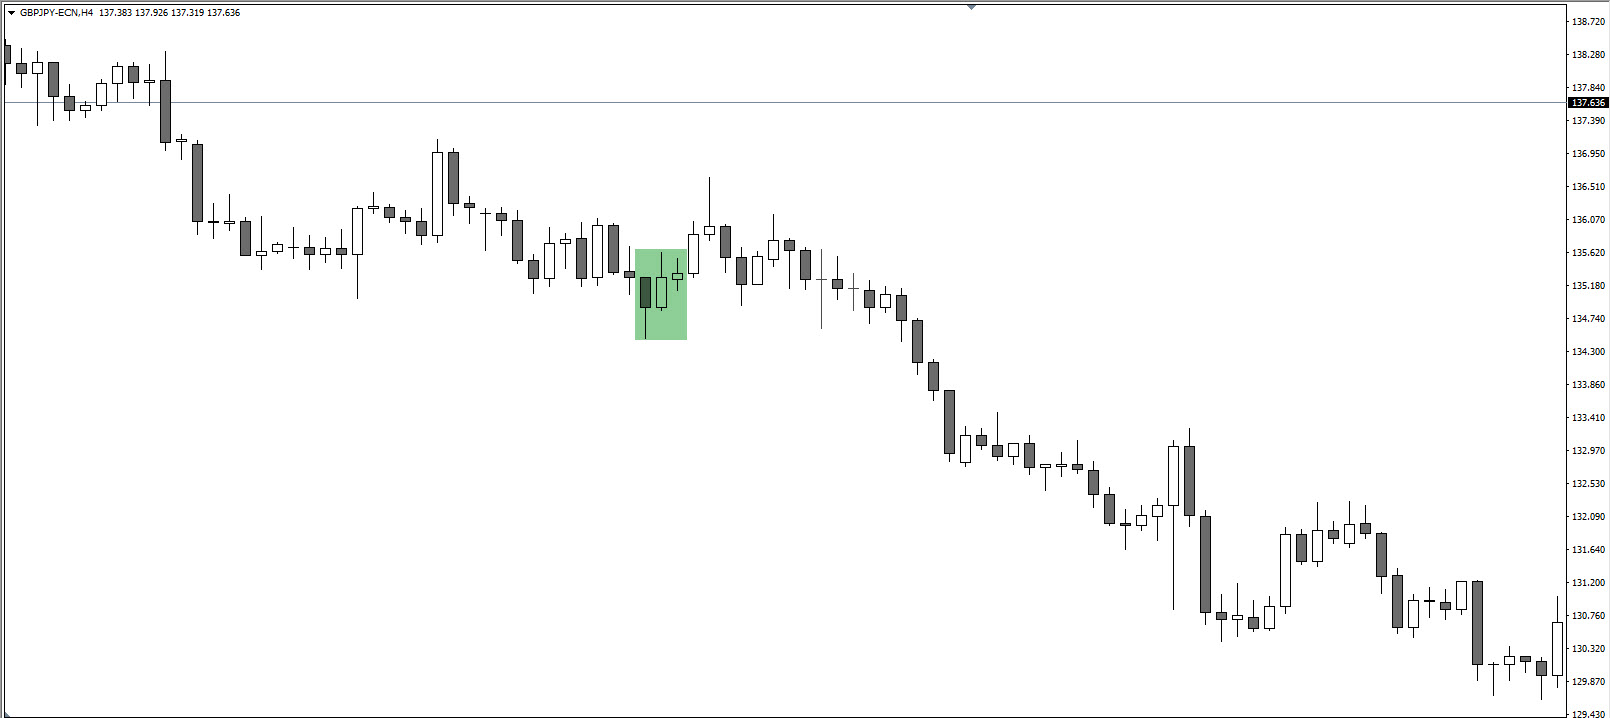
3 Inside Down
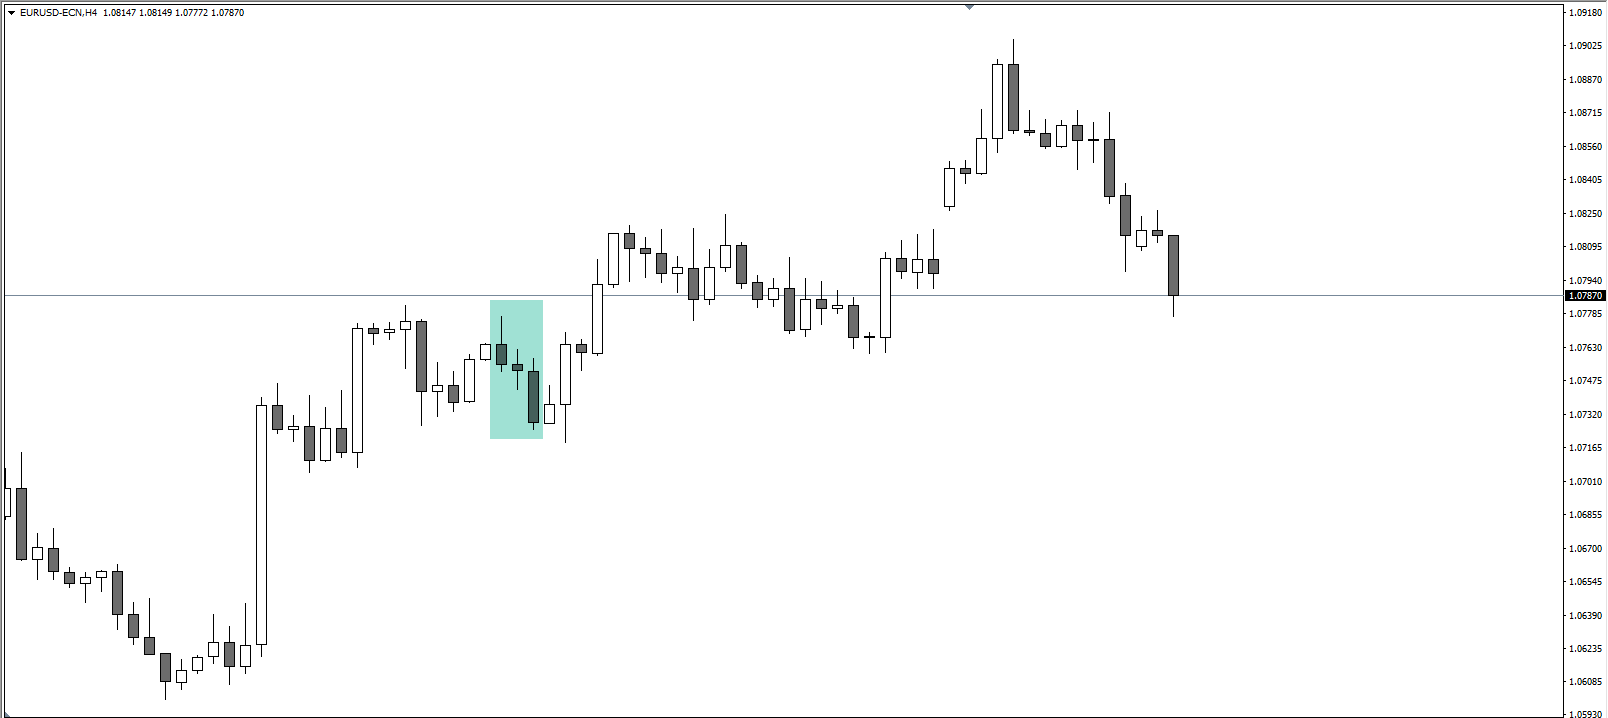
The number of candles in the configuration – 3
- The market is characterised by a prevailing uptrend.
- We see a Bearish Harami (or a Harami Cross) pattern in the first two candles.
- After that, we see a black candlestick on the third candle with a lower close than the second candle.
Evening Star

The number of candles in the configuration – 3
- The market is characterised by an uptrend.
- We see a white candlestick as the first candle.
- After that, we see a short candlestick on the second candle that gaps in the direction of the uptrend.
- A black candlestick is spotted as the third candle.
Upside 2 Crows
The number of candles in the configuration – 3
- The market is characterised by a prevailing uptrend.
- A normal or long white candlestick appears as the first candle.
- The second candle is a short black candlestick that goes up.
- On the last candle, another black candlestick opens at or above the open and then closes below the close of the previous candle, though still above the close of the first candle.
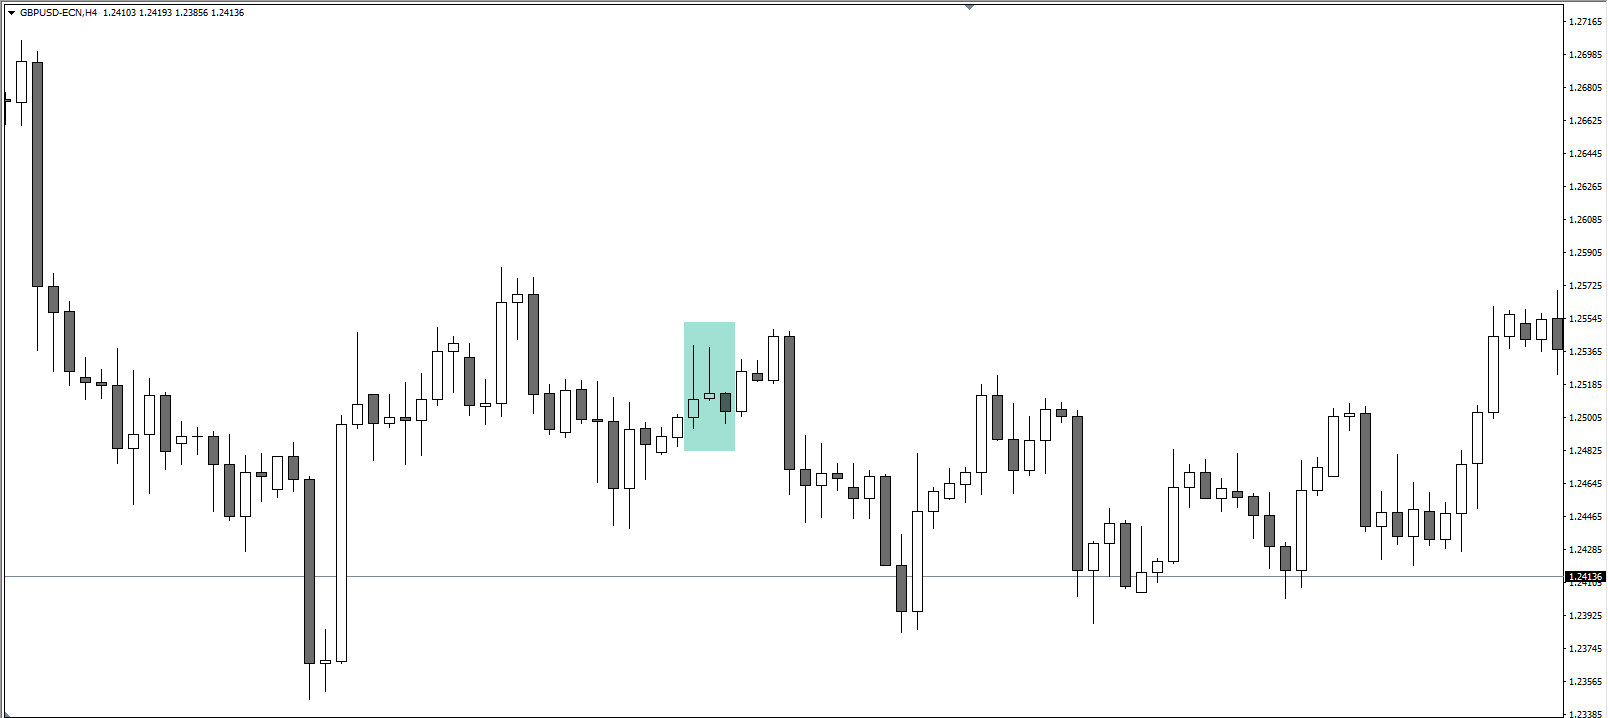
Harami
The number of candles in the configuration – 1
- The market is characterised by a prevailing uptrend.
- A white body is observed as the first candle.
- The black body that is formed on the second candle is completely engulfed by the body of the first candle.
Bearish Abandoned Baby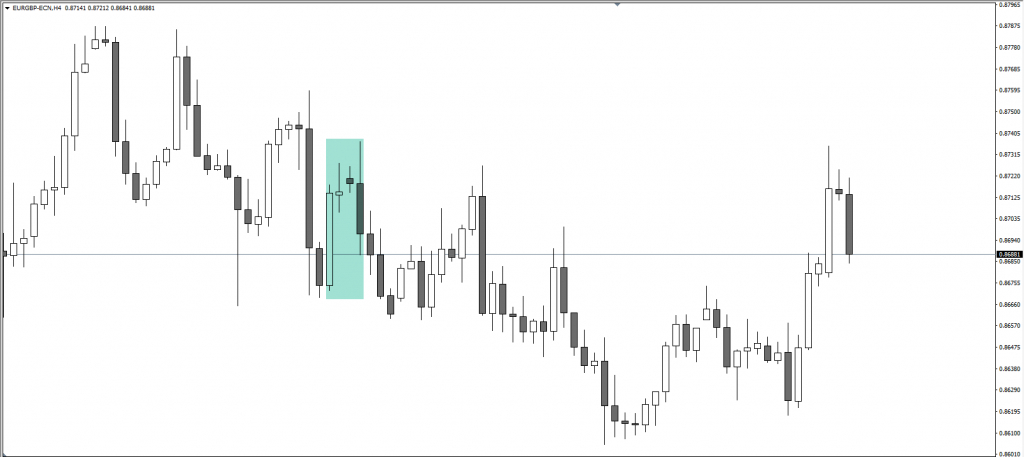
The number of candles in the configuration – 3 or 4
- The market is characterised by an uptrend.
- A white candlestick is observed as the first candle.
- Then we see a Doji on the second candle whose shadow stretches above the upper shadow of the previous candle.
- Third or fourth candle’s black candlestick gaps in the opposite direction with no shadows overlapping.
Meeting Lines

The number of candles in the configuration – 3
- The market is characterised by an uptrend.
- A white candlestick is observed as the first candle.
- We see a black candlestick as the second candle.
- The closing prices are the same or almost the same on both candles.
Dark Cloud Cover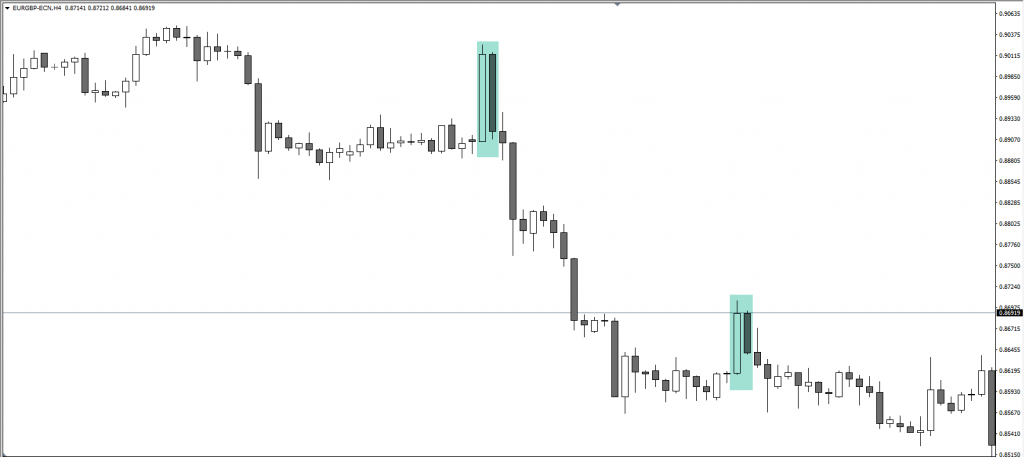

The number of candles in the configuration – 2
- The market is characterised by an uptrend.
- A white candlestick appears as the first candle.
- A black candlestick opens on the second candle and closes more than halfway into the body of the first candle.
- The second candle fails to close below the body of the first candle.
Advance Block
The number of candles in the configuration – 3
- The market is characterised by an uptrend.
- A white candlestick appears as the first candle.
- The next two candles are white candlesticks, with each closing above the previous candle’s close and having an opening within the range of the previous candle’s body.
Bearish Continuation Candlestick Patterns
Falling 3 Methods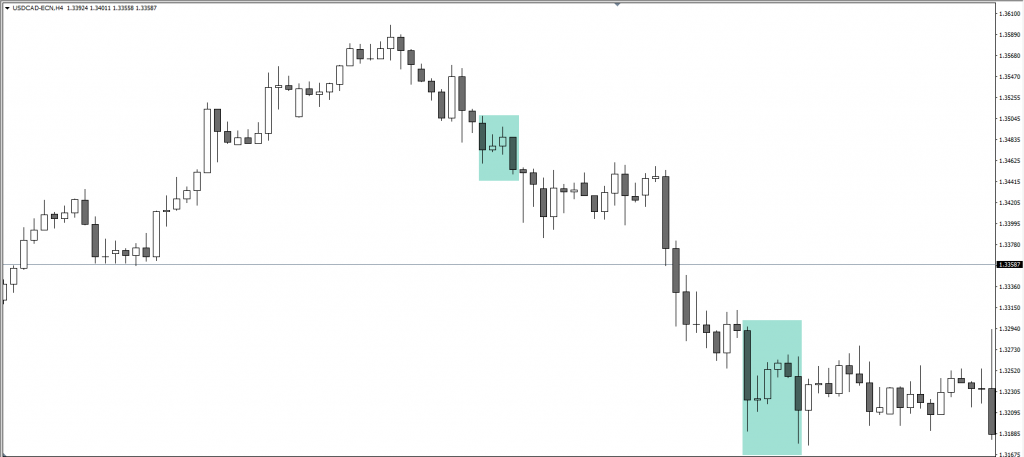

Number of candles in the configuration – 3-6
- The first candle in the pattern is a long black candlestick within a defined downtrend.
- A series of ascending small-bodied candlesticks that trade within the range of the first candlestick.
- A long black candlestick creates a new low, which cues that the sellers are back in control of the direction.
Side By Side White Lines
Number of candles in the configuration – 3
- The first candle we see is a long black candle.
- The second candle is white candle, opening below the low of the first candle and closing barely into the body of the first candle.
Bearish 3 Line Strike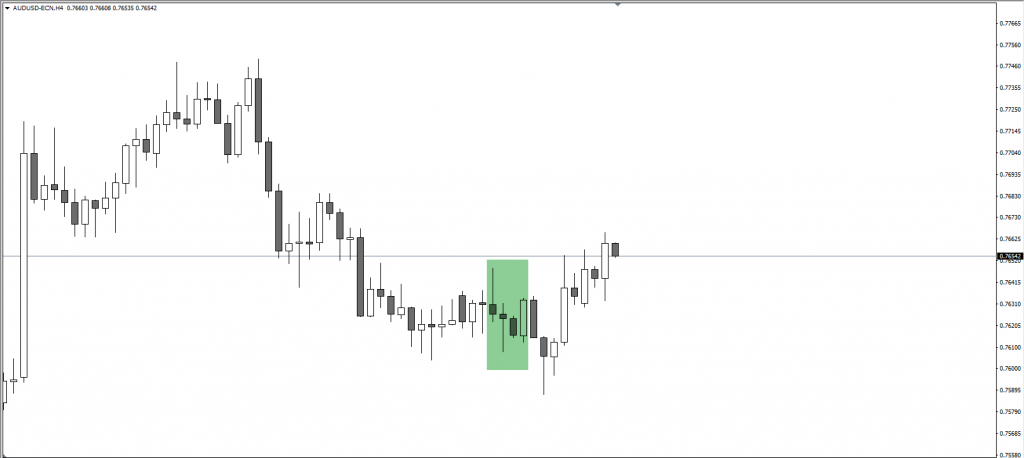

Number of candles in the configuration – 4
- The first three candles make up the Three Black Crows formation or similar two candlestick pattern (variant 2).
- The last candle is a white candle that opens below the third candle and closes above the first candle’s open or the second candle’s open (variant 2).
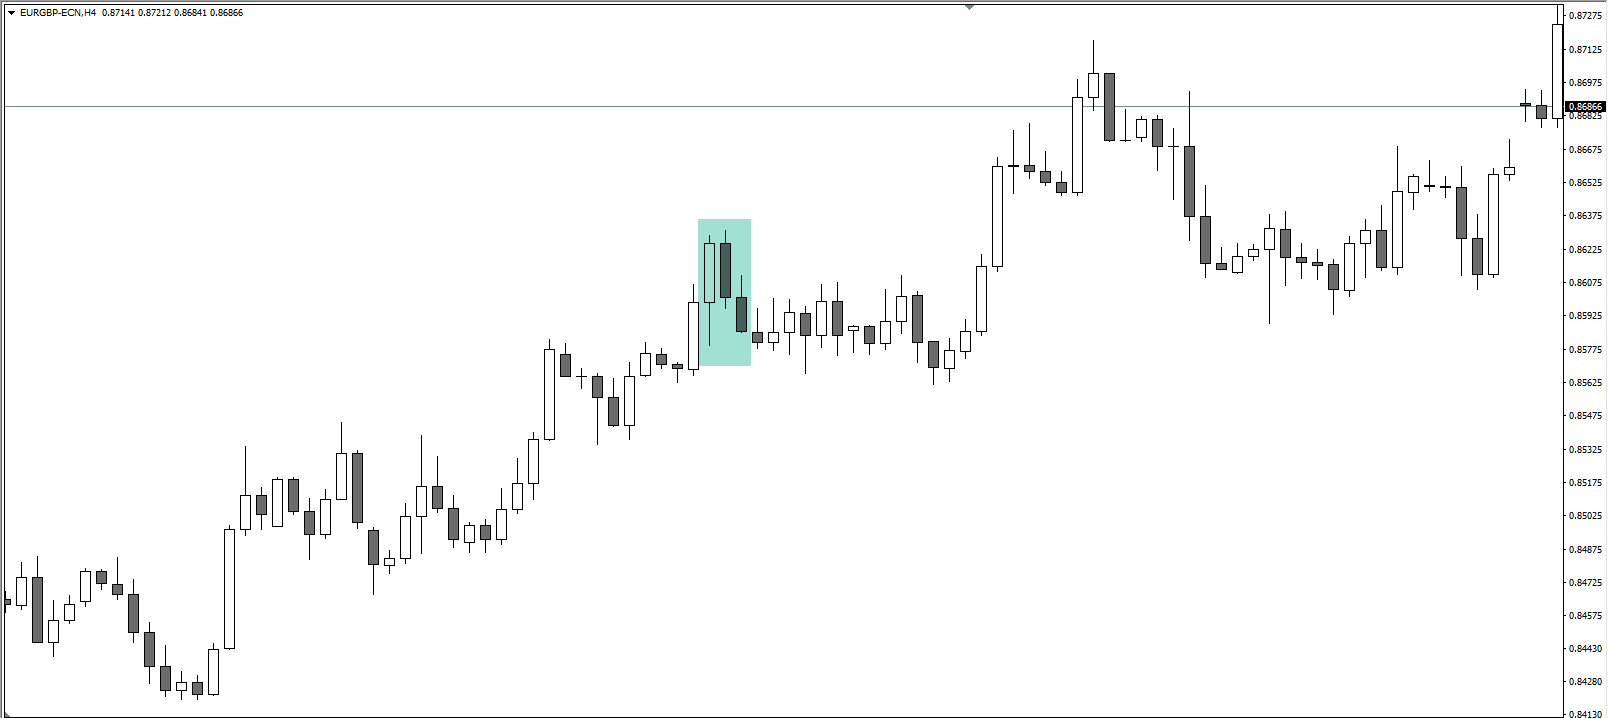
Marubozu Bearish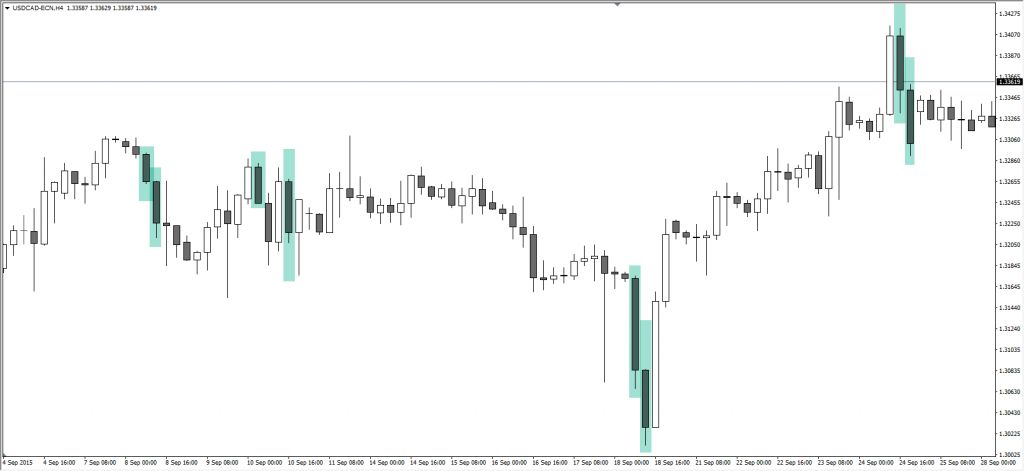

Marubozu defines strong sell off the resistance or strong buying off the support. Marubozu is also known as momentum candles.
Bullish Reversal Candlestick Patterns
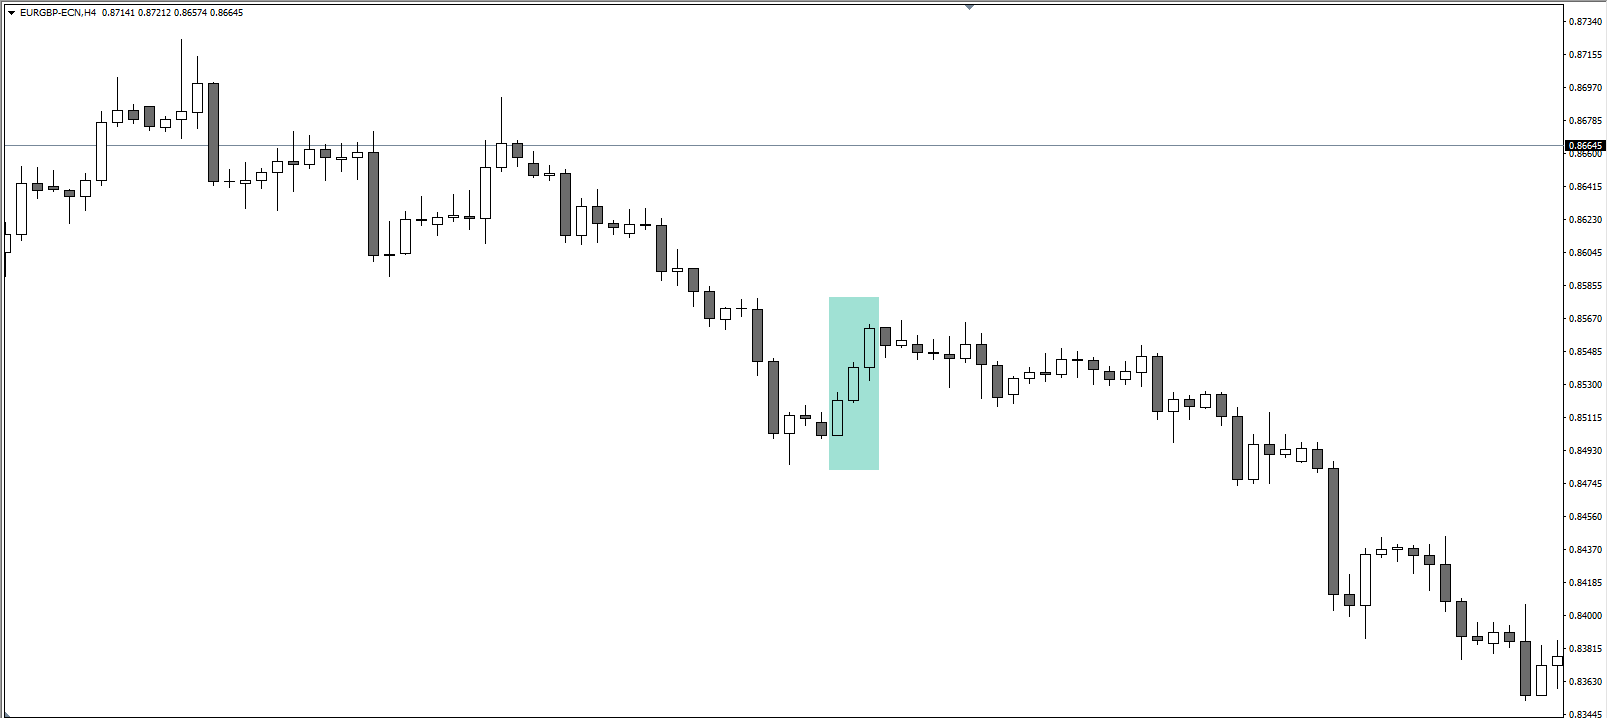
Bullish 3 Inside Up

The number of candles in the configuration – 3
- Connected to bullish Harami Pattern.
- The first candle is bearish and downtrending.
- The second candle is bullish.
- The third candle has a higher close than the second candle.
Bullish 3 Outside Up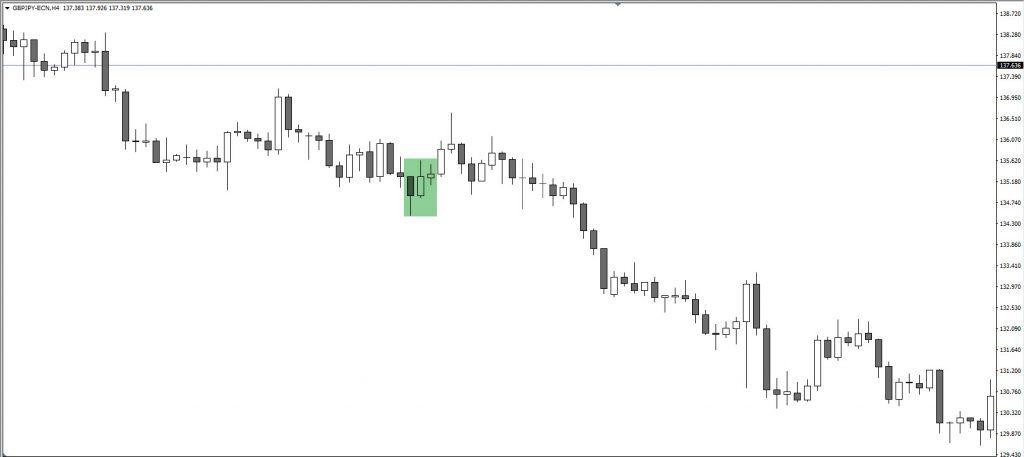
The number of candles in the configuration – 3
- The market is characterised by a prevailing downtrend.
- Followed by the engulfing candle.
- The third candle has a higher close price then the second candle.
3 White Soldiers
The number of candles in the configuration – 3
- The market is characterised by an uptrend or end of downtrend.
- We see a white marubozu candlestick as the first candle.
- Next two candles make higher highs.
Concealing Baby Swallow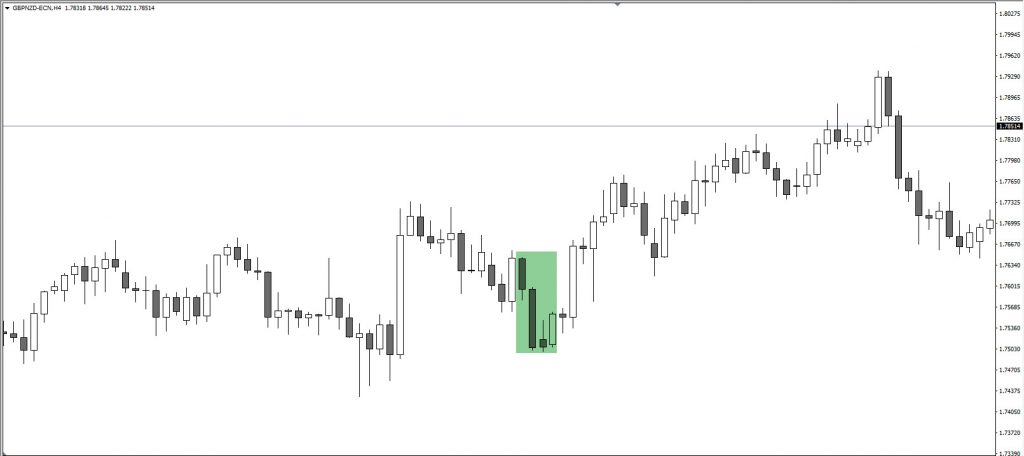

The number of candles in the configuration – 4 (very rare pattern)
- Two falling Black Marubozu candles at the beginning confirm the downtrend.
- The third candle is a short black with or without a downside gap.
- The third candle trades into the previous candles’ body, producing a long upper shadow.
- The fourth black candle completely engulfs the third candle, including the shadow.
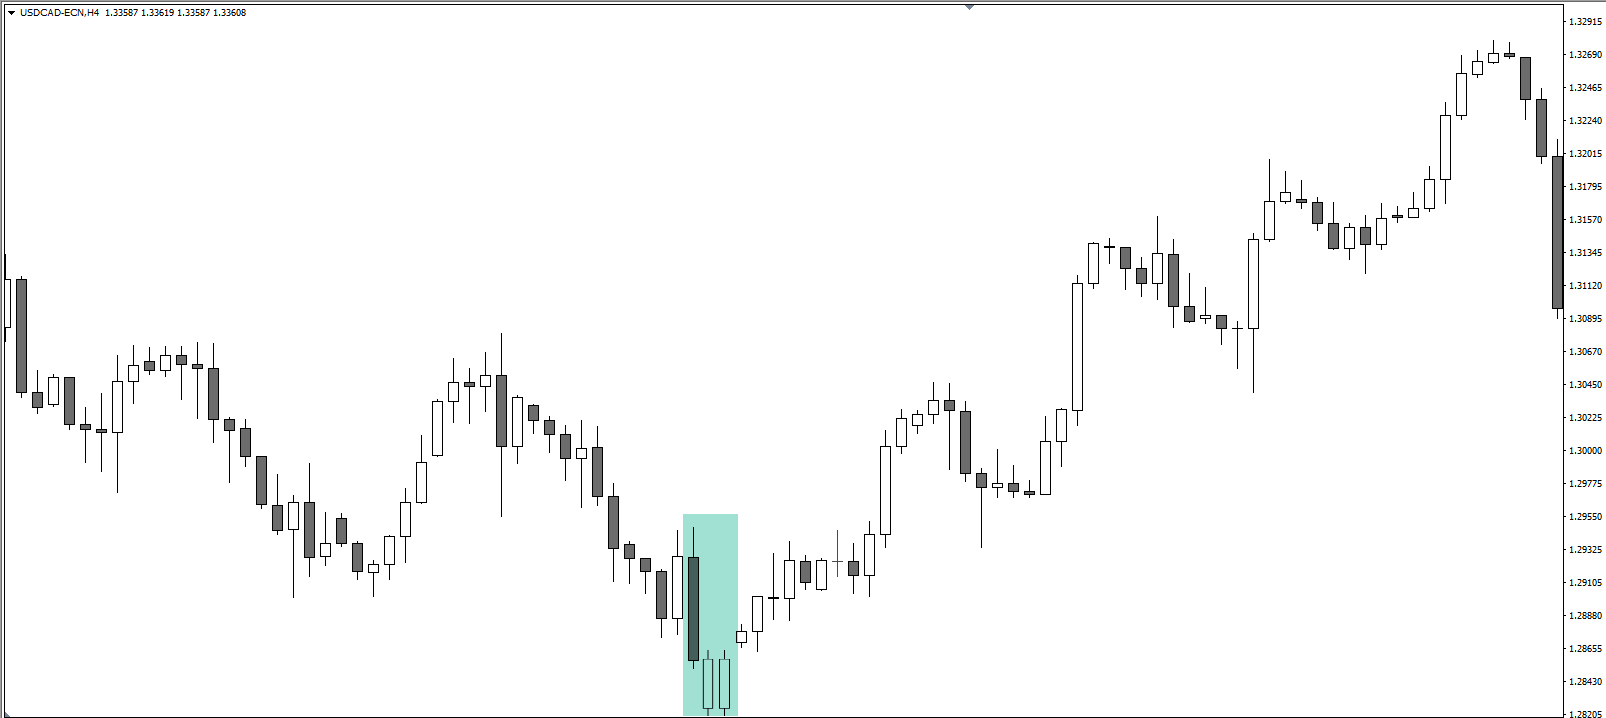
Morning Star
The number of candles in the configuration – 3
- The market is characterised by a downtrend or retracement in a bullish trend.
- Black candlestick is observed as the first candle.
- Followed by a doji or small candle.
- The third candlestick is white bullish momentum candle.
Piercing Line
The number of candles in the configuration – 2
- The first candle is a black momentum candle.
- The second candlestick opens up, goes slightly down and closes more than halfway into the body of the first candle.
- The second candle fails to close above the body of the first candle.
Bullish Belt Hold Lines
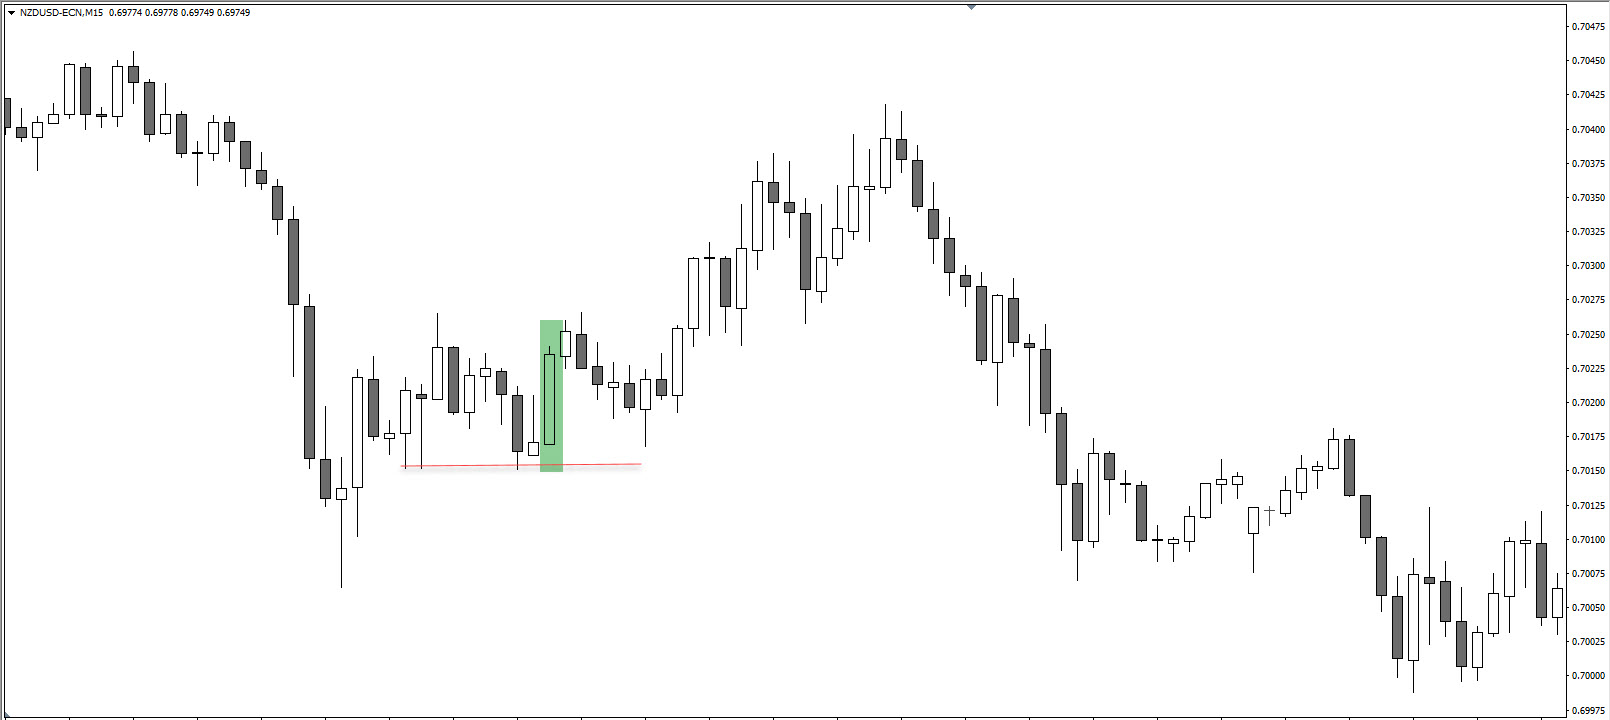
The number of candles in the configuration – 1
- After the drop in the price, we observe a White Marubozu candle at the support.
- Double or triple bottom support precedes the Belt Hold Lines pattern.
Harami Cross
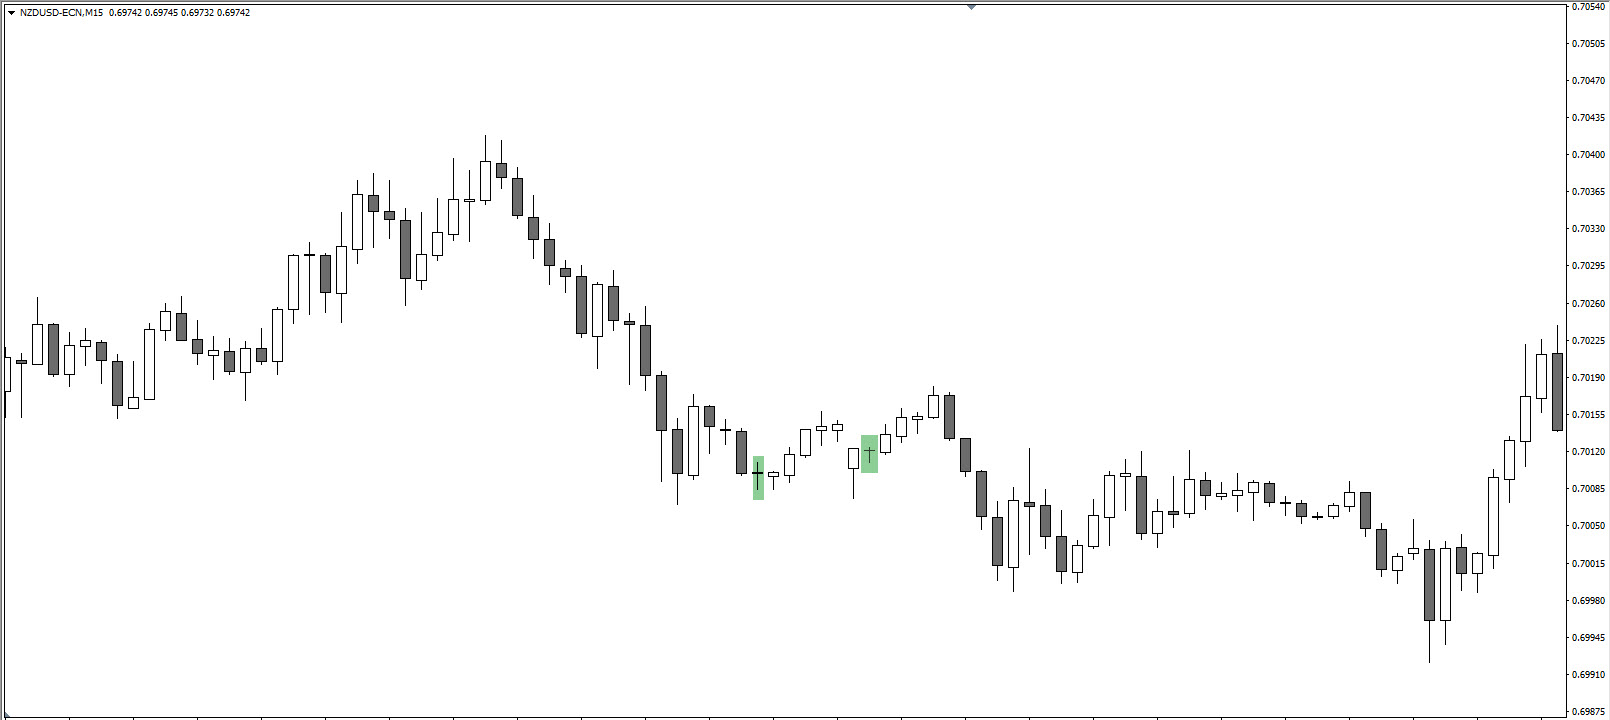
The number of candles in the configuration – 1
- The candle that resembles the cross appears at support.
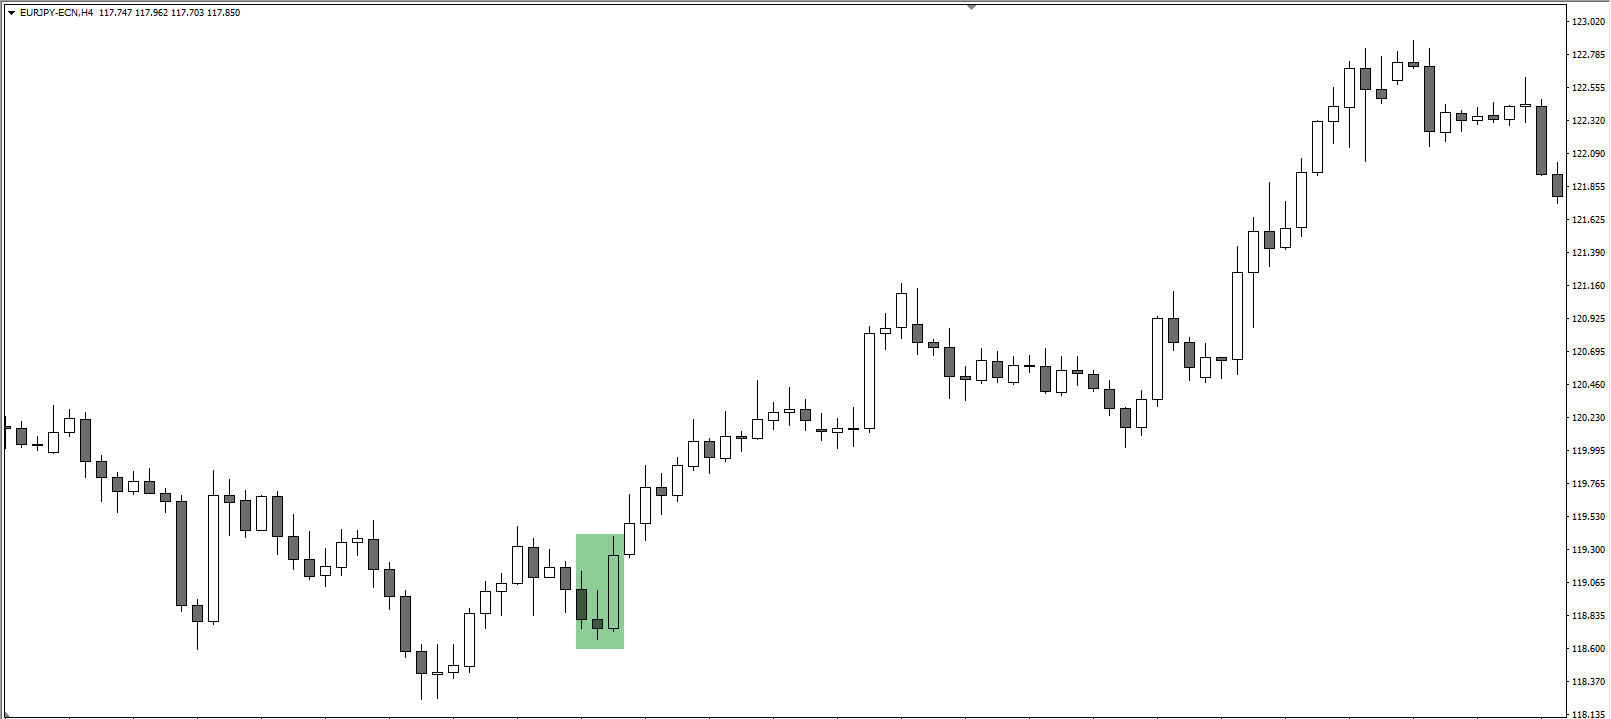
Harami Bullish
The number of candles in the configuration – 2
- The market is characterised by a prevailing downtrend.
- A black candlestick appears as the first candle.
- The next candle is characterised by the white body which is completely engulfed by the body of the first candle.
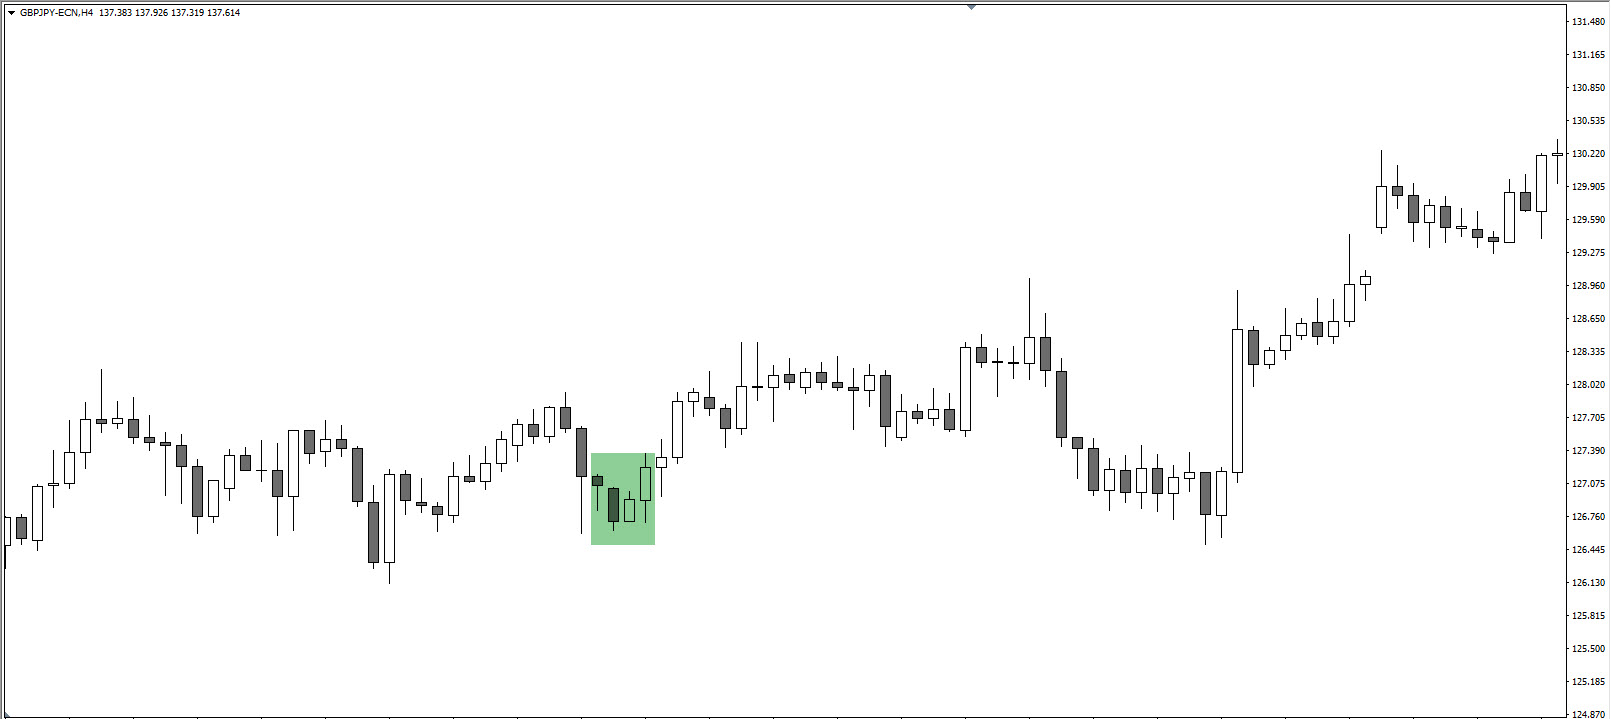
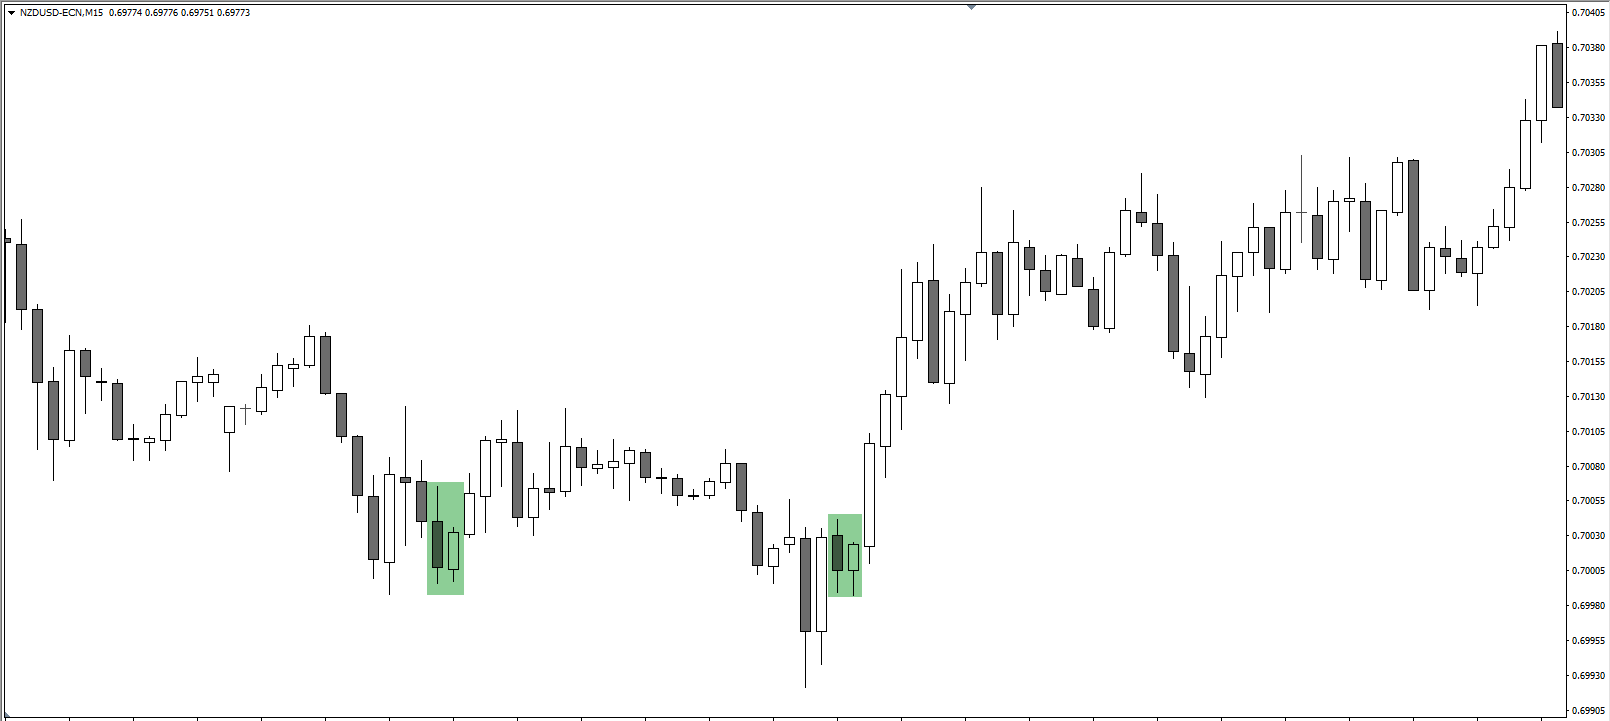
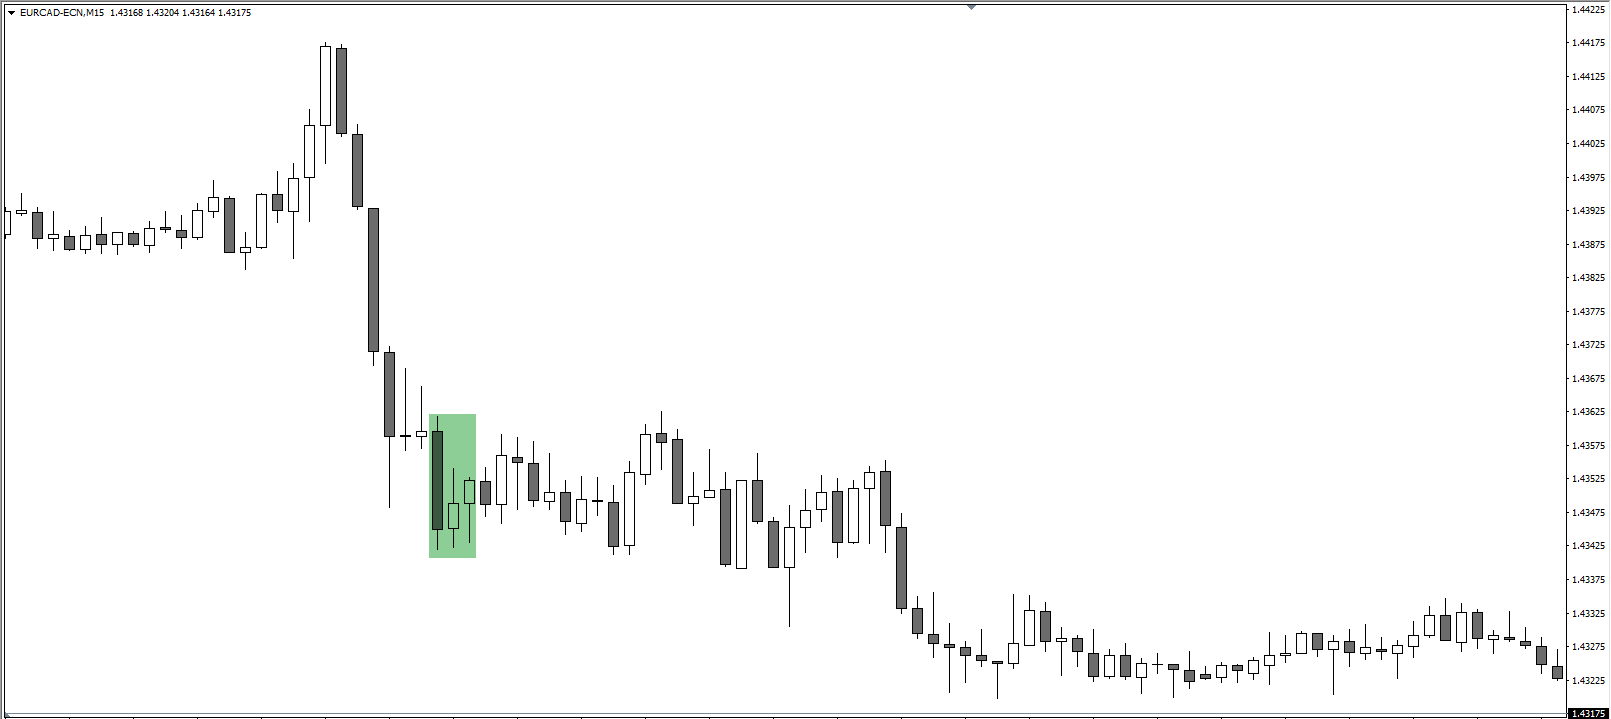
Tweezers
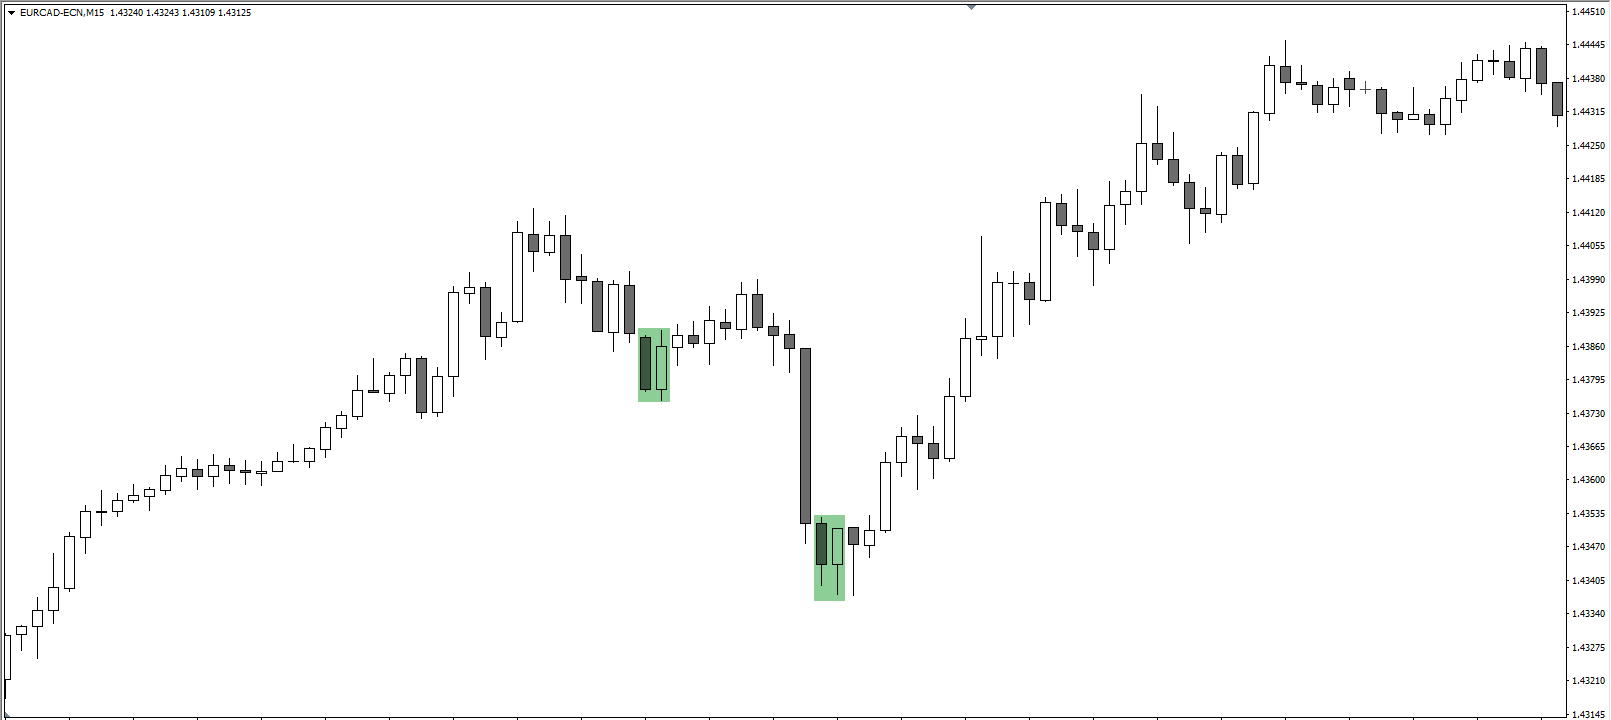
The number of candles in the configuration – 2
- The first candle is a bearish candle and it closes near the support or daily low.
- The second candle completely negates the first so it erases all losses of a previous candle.
Bullish Squeeze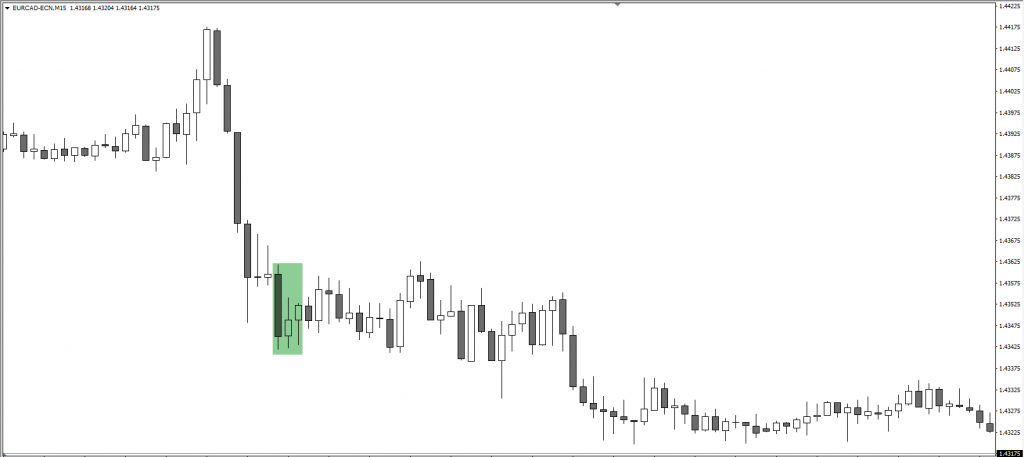
The number of candles in the configuration – 3
- A black candlestick appears on the first candle.
- The second and the third candles each have lower highs and higher lows than the previous candle.
- Their color is not important; the size of the three candles does not matter.
Bullish Continuation Candlestick Patterns
Rising 3 Methods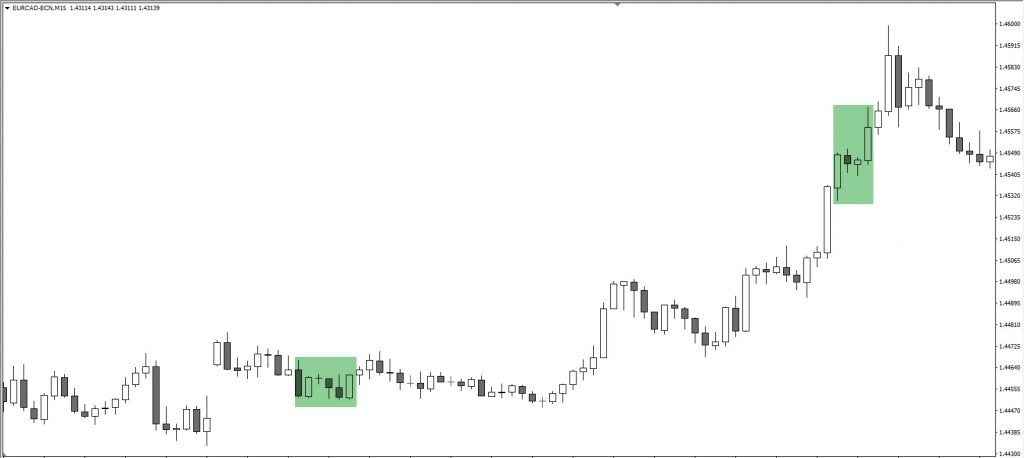

Number of candles in the configuration – 3-6
- The first candle is a strong bullish candle that retraces next three candles, though the second, third and fourth candle remain within the range of the 1st candle.
- Those are characterised by consecutive lower highs where wicks may slightly vary.
- The final candle breaks resistance to the upside and makes a bullish continuation.
Side By Side White Lines
Number of candles in the configuration – 3
- The first candle we see is a long white candle that appears at resistance.
- The second candle is a white bullish candle that follows the first one, making a break through resistance.
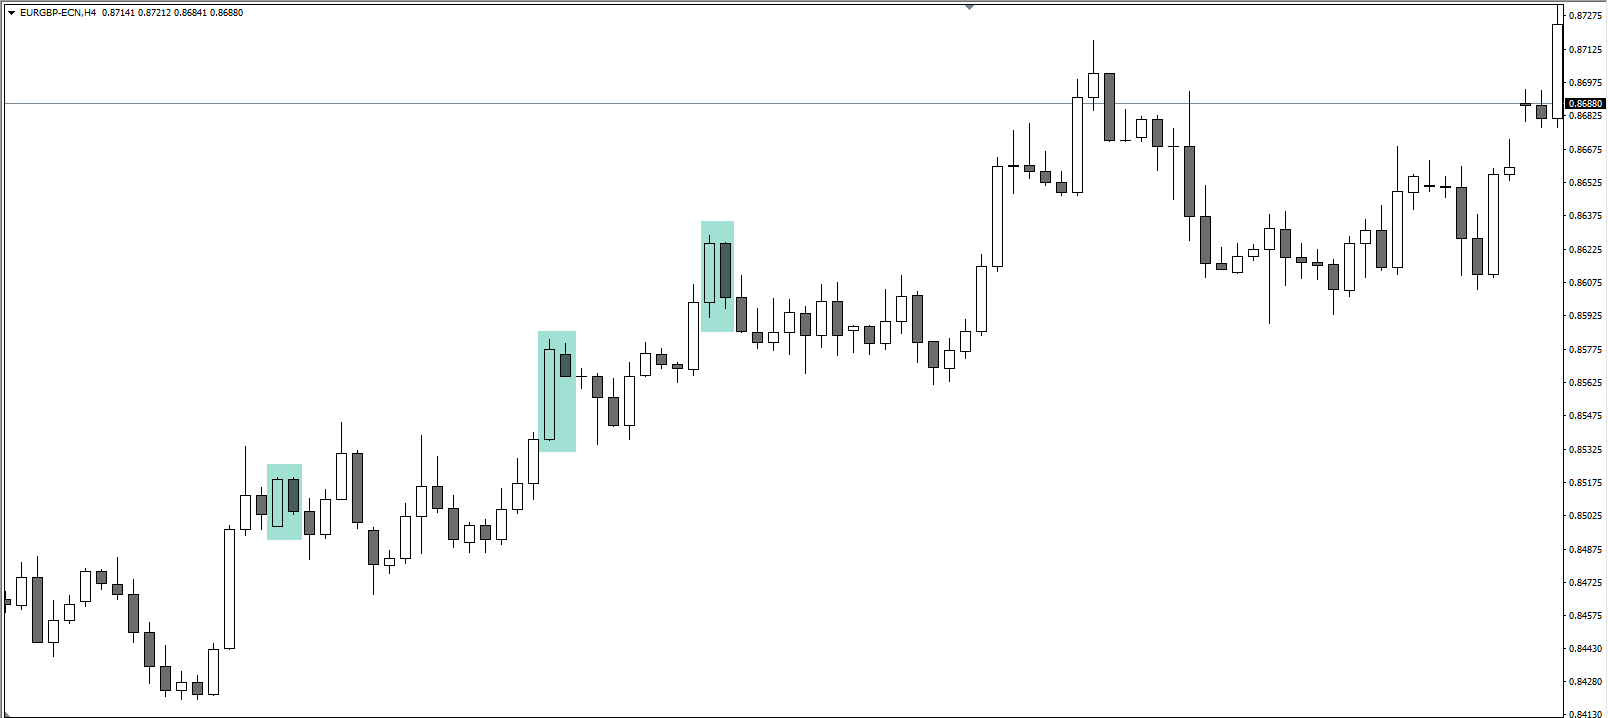
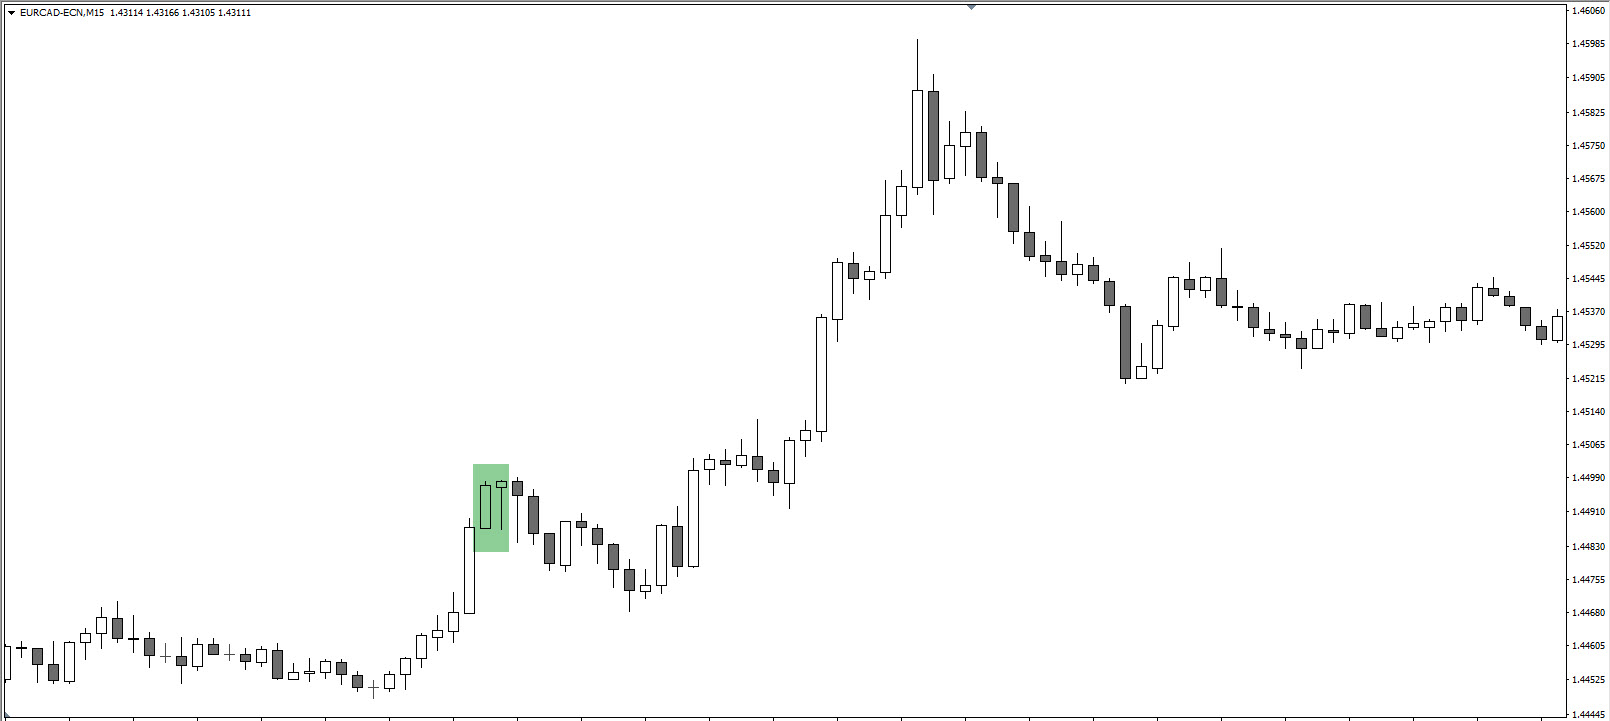
Marubozu Bullish
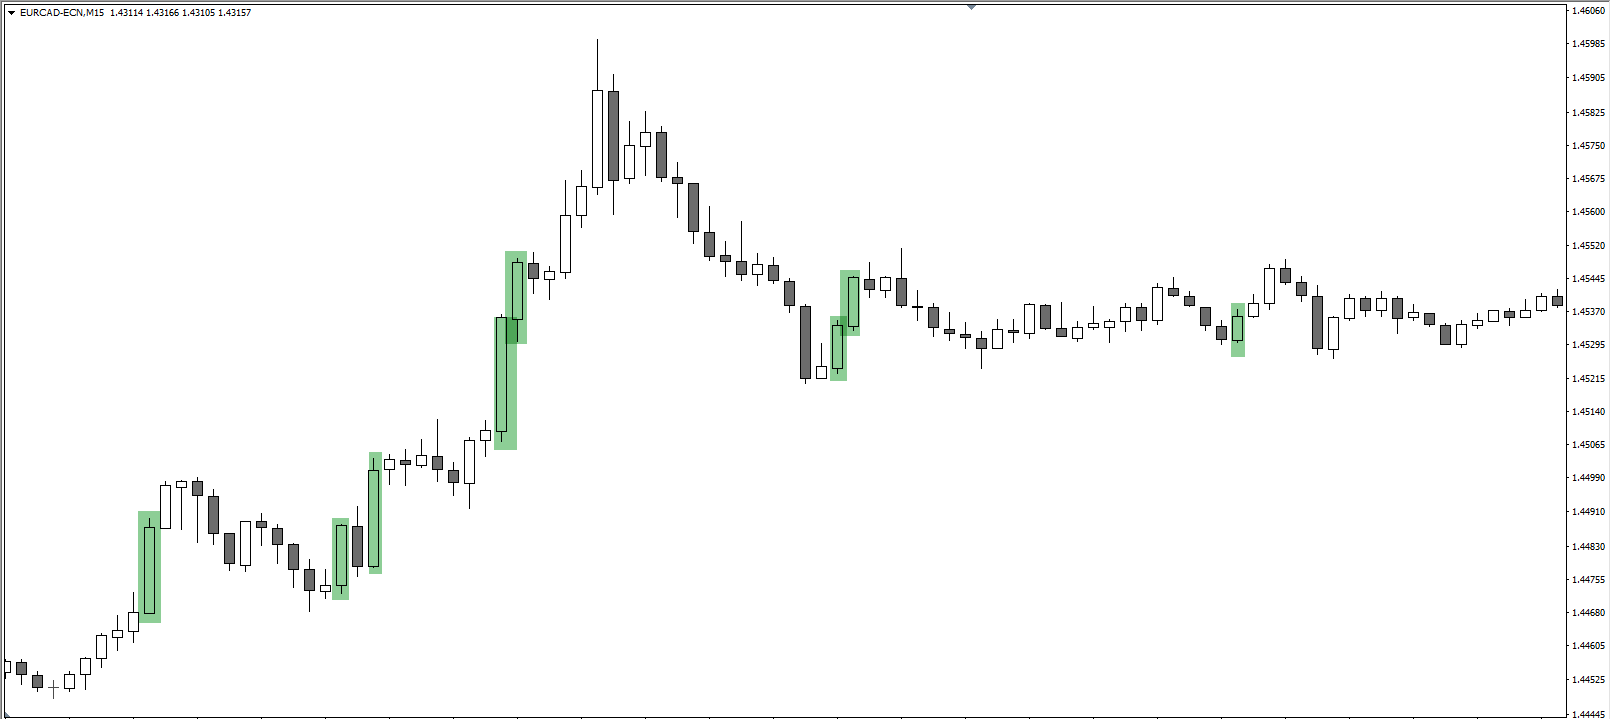
Marubozu defines strong buying off the resistance or strong buying off the support. Marubozu is also known as momentum candle.
Price Action trading has a lot to do with candlestick patterns. Nenad’s CAMMACD system uses some of these patterns for trading purposes. If you want to see how we trade and check results, you can do it here:
Join our World of Trading by starting with ecs.CAMMACD, ecs.SWAT or ecs.LIVE !
Good trading,
Nenad Kerkez aka Tarantula FX
Elite CurrenSea
P.S. Share our passion for trading and learn from our methods and techniques by:
- Joining our premium ecsLIVE channel.
- Subscribing to our ECS YouTube channel with:


Leave a Reply