The Multiple Roles and Sides of the Fractal Indicator
Subscribe
I love using Fractals and everyone who follows my wbeinars at Elite CurrenSEA knows that I use them vigorously. Traders often wonder why I have these ‘funny looking roofs on the candles’. 🙂 This article will explain what those roofs are (Fractal Indicator) and why I think that they are so useful when analyzing the market structure.
What in the world is a Fractal Indicator anyhow?
The Fractal Indicator (fractal) identifies both local and major support and resistance (S&R) levels. The best advantage of the fractal is the ease of spotting S&R throughout the chart. Here are more details:
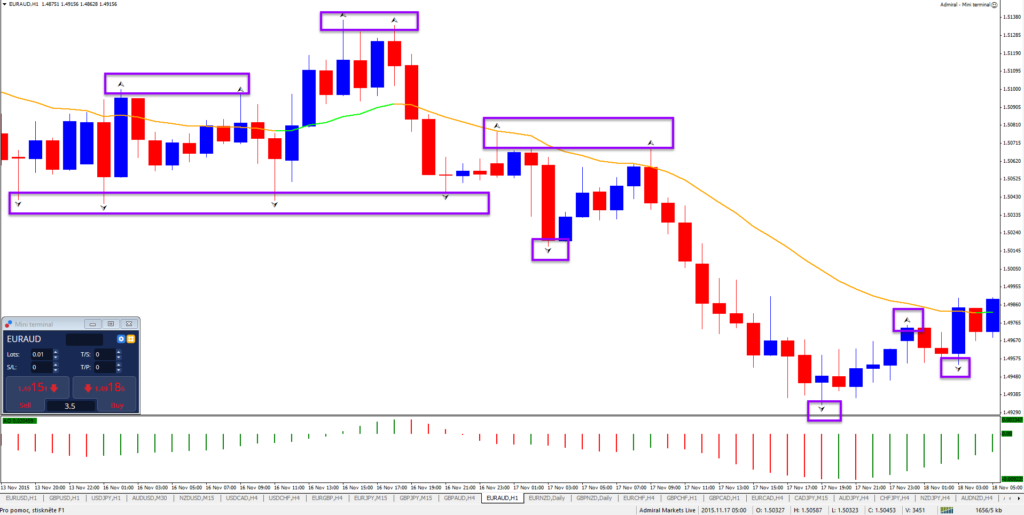
- Buy Fractal: arrow on top. The Fractal Indicator is a series of at least 5 bars, with the highest high in the middle, and two lower highs on both sides. The fractal is a resistance point and is called a buy fractal, if price manages to break above it.
- Sell Fractal: arrow on bottom. The reversing set is also a series of 5 bars or more, with the lowest low in the middle, and two higher low on both sides. The fractal is a support point and is called a sell fractal, if price manages to break below it.

Fractals will automatically appear on the chart. Traders of course do need to add the indicator to their chart. MT 4 users can do add it as follows: go to “Insert”, “Indicators”, “Bill Williams”, “Fractals”.
Be careful though: on live charts fractals can appear on the chart with only 1 candle to the right, which is an unconfirmed fractal. It will disappear from the chart if price pierces through the support or resistance. Always remember that we need 2 CLOSED candles to the right before the fractal is fixed (and will never be removed from the chart).
The fractal concept is created by the trader Bill Williams and is connected to chaos theory, which explains that the market is fractal in nature:
Fractal in nature means that the market makes repetitive movements on all levels or time frames – regardless of size. These recurring patterns might seem ad random, but actually have an order to them, which can be explained by for instance the Elliott Wave Theory. In that regard chaos has order in it on a higher scale.
The mathematical definition of a fractal also says something similar:
“Fractals are typically self similar patterns, where self-similar means they are “the same from
near as from far… Fractals may be exactly the same at every scale.” (source: Wikipedia)
But How Can You Use Fractals?
Fractals are a part of the technical analysis family and offer many advantage to your trading plan and FX trading strategies. Here is how fractals can be useful:
- To identify breakouts;
- To see as support and resistance levels;
- To spot tops and bottoms;
- To place entries;
- To place stop losses;
- To use for Fibonacci retracement levels;
- To connect trend lines;
- To determine the trend.

Many traders use Bill William’s indicator in cooperation with other Bill William’s indicators. One of the most used indicators in combinations is the alligator indicator, which is sometimes used as a filter.
Ultimately I use the fractal at occasion for all 8 reasons in fact and that is why I always have on the chart!
There are some tips that are good to keep in mind:
- Higher time frames are more important and reliable;
- Higher time frames generate a lower number of fractals and signals;
- Using multiple time frames is very useful; the long–term chart can be a great filter for short-term fractals;
- Fractals are great for trail stops; using 2 fractal levels (not 1) gives space to the trade.
Next week we will continue a new series of posts and YouTube videos on trend lines and trends!
Do not forget to sign up for an account with Admiral Markets via our link and get a discount for our systems at ECS based on your trading volume.
Good trading!


Leave a Reply