Bitcoin 2021 vs Bitcoin 2017: How The Bull Trends Are Similar and Different


Bitcoin Bull Run 2017 vs 2021
- Run Bitcoin in January 2022
- Bull Run Comparison Between Bitcoin in 2021 and 2017
- Similarities between Bitcoin’s uptrend in 2021 and 2017
- Differences between Bitcoin’s uptrend in 2021 and 2017
Bitcoin from 2017 to 2021
Bitcoin made giant headlines in the financial news at times during 2021. After a strong bullish run in 2016 and 2017, the cryptocurrency giant went into a winter sleep for a few years.
But since the 4th quarter of 2020, the world’s largest cryptocurrency in terms of total market value was fully awake again and roaring out loud.
Between 1 October 2020 and December 2021, Bitcoin has managed to evoke joy and fear again in a very short time frame. For both the largest Bitcoin supports and its largest critics.
Most traders are asking themselves this: is the 2021 bull run over? How does it compare it to the 2017 uptrend?
In this article, we try to answer this question. But we also make an attempt to compare the 2017 and 2021 bull runs with each other. What are the similarities and differences? Let’s compare Bitcoin 2021 and 2017 first before comparing bitcoin 2013 vs 2017 vs 2021. We will also do a Bitcoin bull run comparison.
Bitcoin Bull Run Comparison Between Bitcoin in 2021 and 2017
Bitcoin 2017 chart vs 2021: record after record was set with the Bitcoin 2017 trend. The uptrend actually already started around October 2015 according to our definition of a trend.
The 2017 Bitcoin bull run lasted till December 2017 for a full 2 years and 3 months (total of 27 months). Most of the weekly candles closed for a higher high (see image below).
The Bitcoin uptrend tested and bounced at the 21 ema zone of the weekly chart for a total of 6 times. The 7th attempt to test the 21 ema indicated the end of the uptrend.
In 2017 Bitcoin grew 121x in value, from a low around $160 to a high at $19,357.
Now let’s compare the 2017 bull run with the current one:
| Bitcoin 2017 | Bitcoin 2021 (Dec) | |
| Multiple of high vs low | 121.2x ($19,357 vs $159.70) |
22.1x ($69,000 vs $3,122) |
| Time length of bull run | 27 months | 17 months |
| Number 21 ema bounces on weekly chart | 6x | 2x |
As you can see in the above table, the 2021 Bitcoin bull run is in many ways modest compared to the 2017 Bitcoin bull run. What information do we learn when comparing 2017 vs 2021 Bitcoin?
The 2021 uptrend was substantially smaller than the uptrend in 2017. In fact, there were only two pullbacks on the weekly chart (price going below the 21 ema zone) that took place on in May 2021 and December 2021.
But does the break below the 21 ema in December 2021 on the weekly chart indicate a pullback or rather the end of the uptrend?
The 2021 Bitcoin Bull Run: The Scenarios
If the 2021 Bitcoin uptrend would have been equally strong as the 2017 uptrend, then the uptrend could develop as follows:
| Bitcoin uptrend remaining | |
| Multiple of high vs low | 121.2x * 3,122 = $378,386 |
| Time length of bull run | July 2022 |
| Number 21 ema bounces on weekly chart | 4x remaining bounces |
If the 2021 Bitcoin uptrend were to be equally strong in relative terms as the 2017 Bitcoin uptrend, then price action could have reached a whopping $378,386 around June 2022. Price action could also retest the 21 ema zone on the weekly chart another 4x times. That is if we compare BTC 2017 vs 2021.
Most price target estimates on Bitcoin in 2021 were however more conservative. Many of the predictions are aiming at $100,000 to $150,000. Some even mention $250,000. But higher targets are usually associated with dates further into the future, like 2024-25.
Let’s compare the 2021 Bitcoin bull run now with the other two years, 2011 and 2013:
| Bitcoin 2011 | Bitcoin 2013 | Bitcoin 2017 | Bitcoin 2021 (2 Sep) |
|
| Multiple of high vs low | 45.6x ($31.9 vs $0.70) |
545x ($1090 vs $2) |
121.2x ($19,357 vs $159.70) |
20.7x ($64,736 vs $3,122) |
| Time length of bull run | 9 months | 17 months | 27 months | 14 months |
| Number 21 ema bounces on weekly chart | 0x | 5-6x | 6x | 2x |
Despite the decent growth in 2021, the bull run in 2021 was modest.
The Bitcoin Bull Runs: The Uptrend Is Over
The Bitcoin bull run ended in 2011, 2013, and 2017 when price action showed these 3 signs:
- Bearish candlestick patterns on the weekly chart.
- A time pattern where 6 weekly candles failed to make a new high.
- Price broke or closed below the 21 ema zone on the weekly chart without breaking back above the 21 ema zone again.
An uptrend was clearly visible as long as the angle of the 21 ema zone on the weekly chart remained bullish. If price action did retest the 21 ema zone on the weekly chart, then the 21 ema zone was vital for the uptrend: a re-break above the resistance kept it alive but a failure to do so indicated the end of the uptrend.
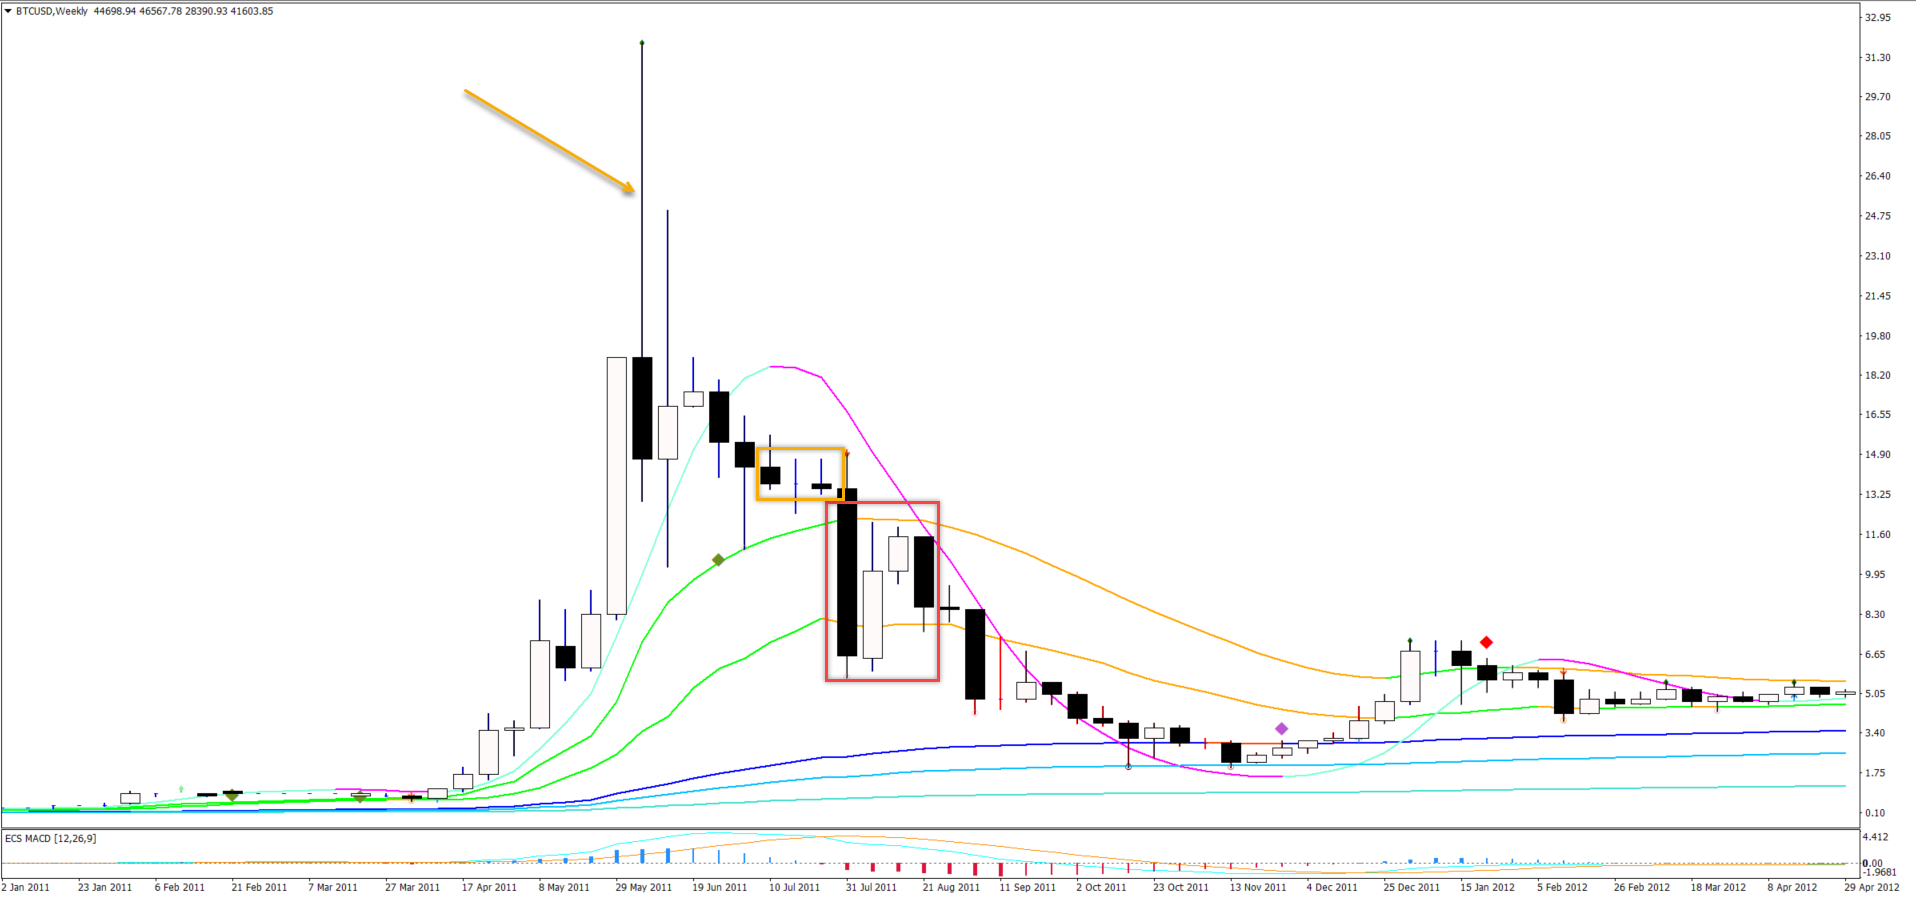
The end of the Bitcoin uptrend in 2011
Let’s review the end of the trend in the year 2011 in the image below. As you can see, the 21 ema zone on the weekly chart was broken and price action failed to break above it again (red box). This marked the definitive end of the uptrend, even though price action (orange arrow) and time patterns (orange box) already provided earlier signals.
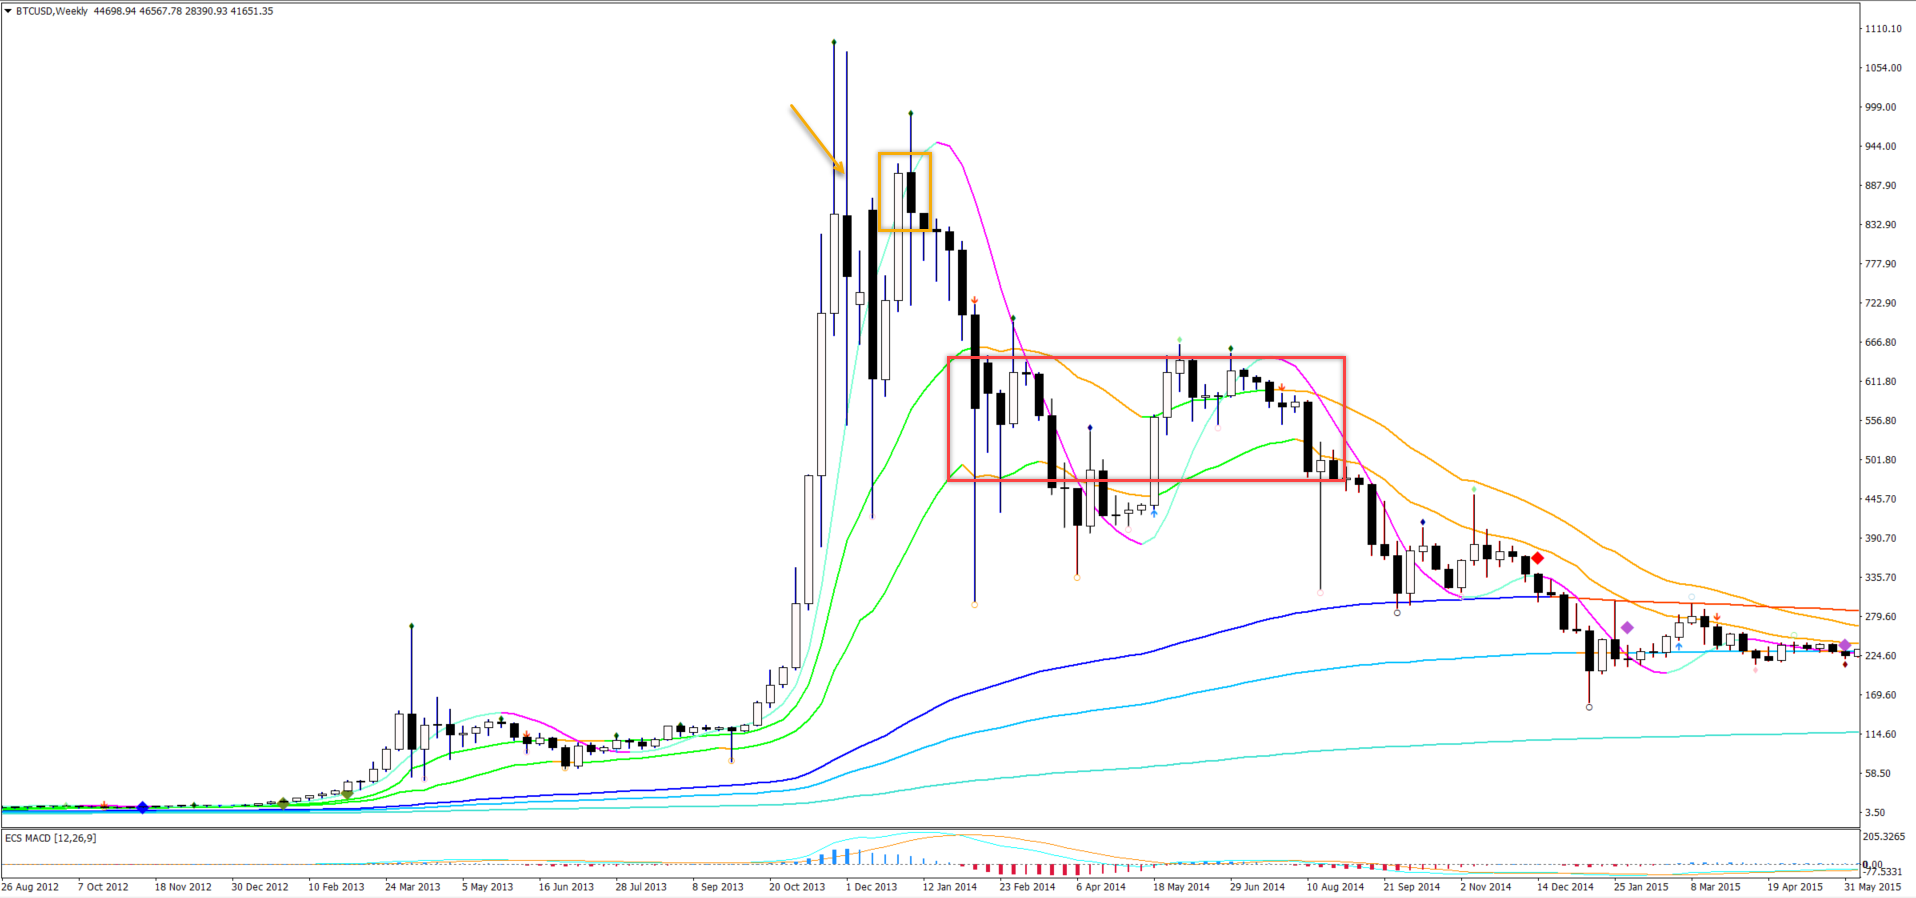
The end of the Bitcoin uptrend in 2013
Now let’s review the end of the trend in the year 2013 in the image below. The pattern is quite similar to 2011. First there were candlestick patterns (orange arrows) warning of a reversal. Then there was a time pattern where 6 weekly candles failed to break for a new high. Followed by a break below the 21 ema zone and inability to break above it again (red box).
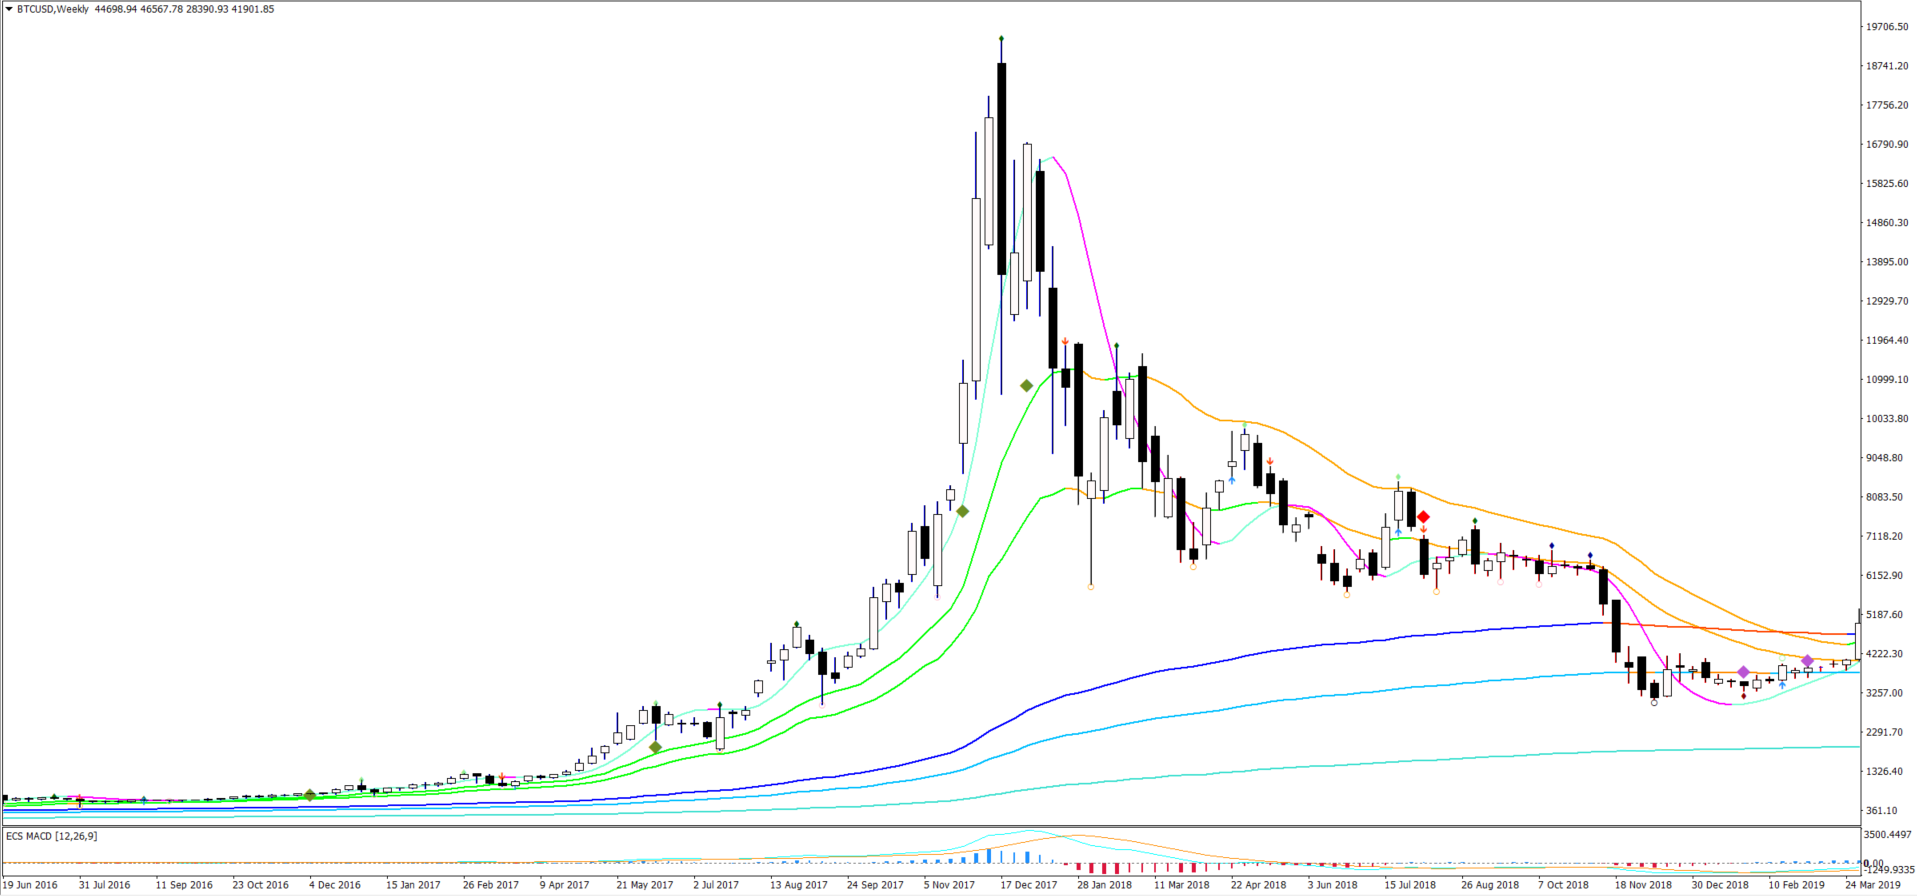
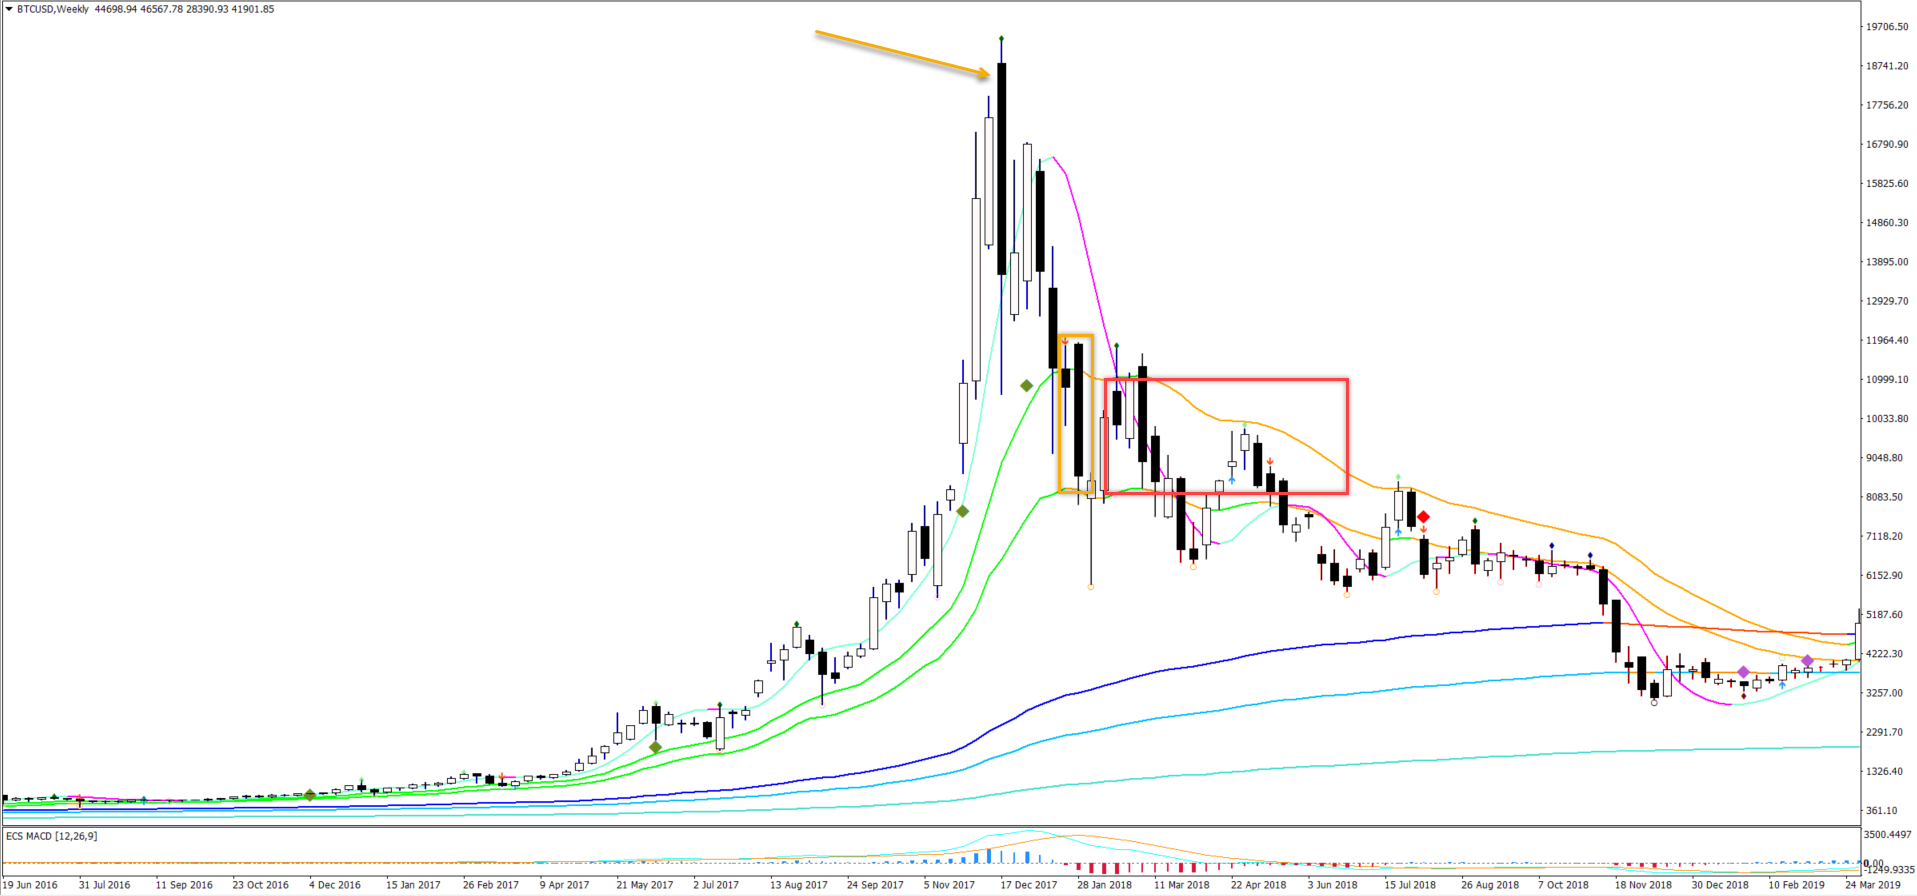
The end of the Bitcoin uptrend in 2017
Now let’s review the Bitcoin 2017 trend and end of the trend in the image below. The pattern is a bit different than 2011 and 2013. There were candlestick patterns (orange arrows) warning of a reversal. But before the time pattern was confirmed, price action had already moved down quite a lot. The break below the 21 ema zone and inability to break above it again (red box) was again the full signal that the uptrend was over. It is very interesting to compare Bitcoin 2013 vs 2017 vs 2021, so let’s now review 2021. Let’s compare the Bitcoin 2017 vs 2021 chart.
The end of the Bitcoin uptrend with the current 2021 run
June 2021
The image below shows the weekly chart in 2021 (end June) in the image below. As you can see, no substantial weekly reversal patterns are visible as yet. Not in our eyes at least. This indicates that the uptrend might not be over yet. The Bitcoin chart 2017 vs 2021 is different.
BUT the time patterns are showing a more dangerous spot, however, and from that point of view the 2017 vs 2021 Bitcoin price chart is not much different. For instance, price action has not been able to close for a higher high for 10 weeks. Plus price action has broken below the 21 emas and stayed below them. Considering the strong decline, this seems to be a tall order. This means that a period of consolation could take place in the near future. The uptrend could still continue after that corrective period as long as price action can break above the 21 ema zone.
The 21 ema zone has now been tested for the 2nd time. But price action has broken below it, which is a first bearish signal. If we can learn anything from the past, then it is clear that a break above the 21 ema zone is much needed to keep the uptrend alive. If price action goes sideways too long, then also a break above the resistance fractal is needed as well. If price action fails to do so, then a larger retracement will quickly become more likely.
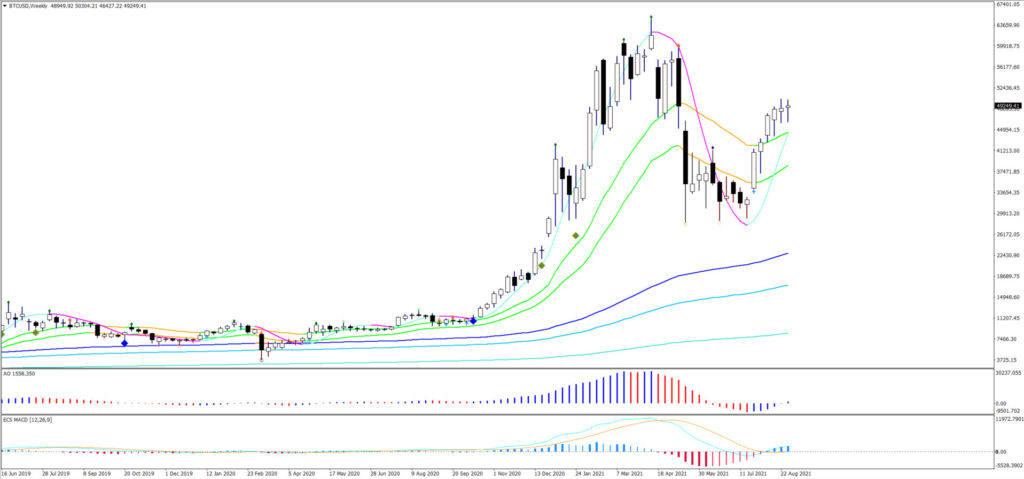
September 2021
As you can see in the image above, price action has managed to break above the 21 ema zone on the weekly chart. This is a positive development. But price action still needs to stay above the 21 ema zone.
Or if price action does test the 21 ema zone, then a bullish bounce in that support zone is critical.
If one of the two patterns occur, then an uptrend could still be a valid pattern.
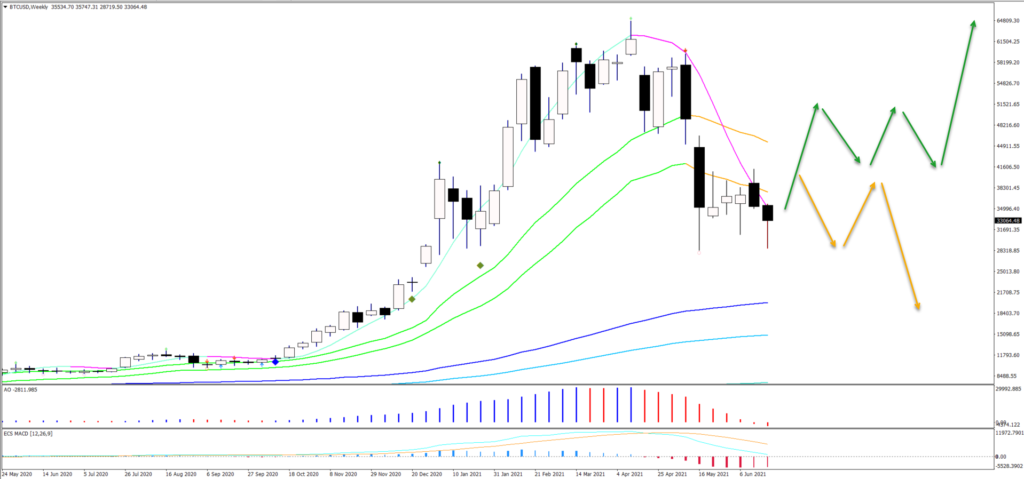
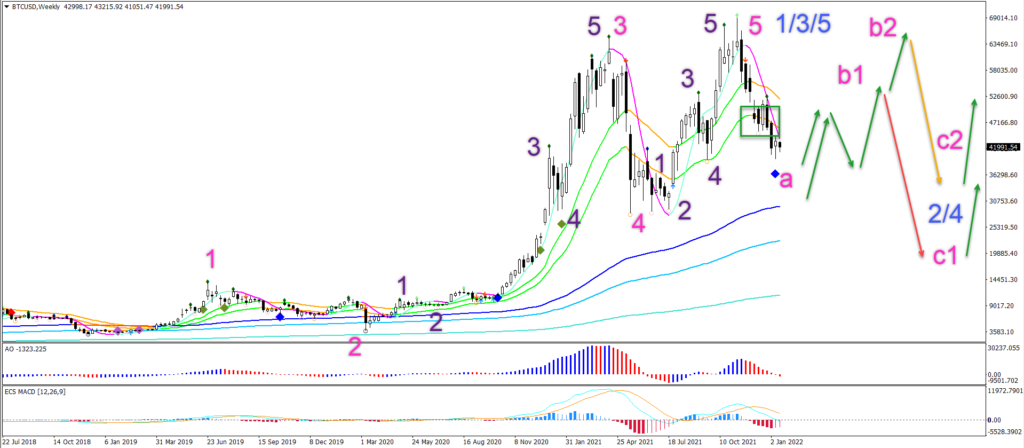
January 2022
The uptrend is probably over – unless price action shows a strong move up above the 21 ema zone on the weekly chart.
Why? Well, there are several factors.
First of all, price action has clearly completed 5 waves up (purple) in the 5th wave (pink).
Secondly, the 21 ema zone was unable to stop price action from its decline. The bulls were not strong enough to find support at this critical zone. A quick bounce back up at the 21 ema zone could have indicated a retracement within the uptrend. But the bearish breakout is a strong indicator that the uptrend is probably over.
Thirdly, the bearish impulse is strong since price made a new high. The impulse lower is indicating a potential wave a (pink).
If the wave A (pink) retracement is over, then a bullish bounce could occur.
- But the bullish bounce could also occur at a lower price level after another dip down.
- In any case, eventually, a bullish bounce is expected.
- But if this Elliott Wave analysis is correct, then the bullish bounce should only be a wave B correction.
- Waves B seem like a continuation of the uptrend, but in fact are reversal patterns.
- The wave B could finish soon (like wave B1 suggests) or high near the top (like wave B2 shows in the image above).
- If the correction ends shallow (B1), then a deep wave C corrective swing is expected (wave C1 in image above).
- If the correct ends deep, near the top (B2), then the wave C corrective swing should be shallow (wave C2 in image above).
What if?
Although a trend could always become extended, the impulsive price action after peaking at $69,000 seems to suggest that the trend is over. The only way the uptrend could still be alive is if there is a contracting triangle chart pattern (abcde in image below) where price goes sideways for another 4-6 months and then breaks north.
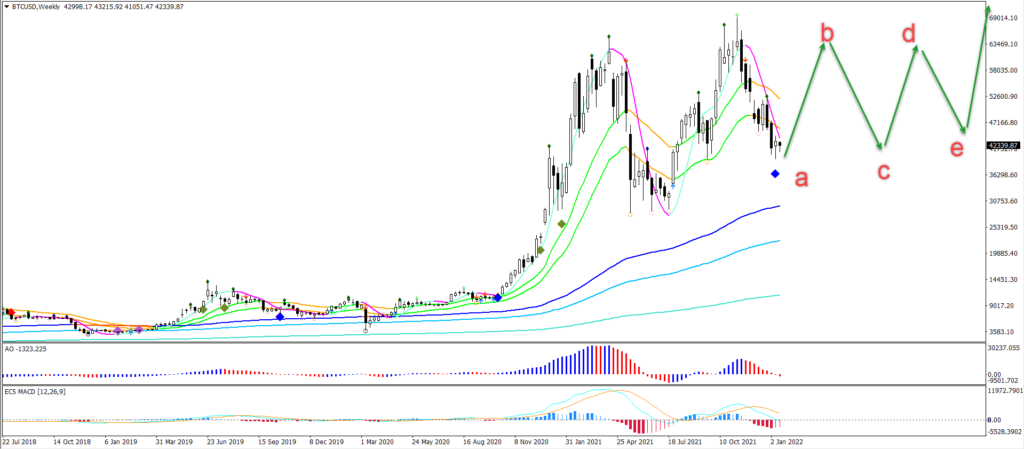
Otherwise, we expect that the BTC uptrend 2021 is over and a retracement period will occur in 2022 and 2023 until a new uptrend cycle might start at the end of 2023 or in 2024.
Similarities Between Bitcoin’s Uptrend in 2021 and 2017

Price Volatility
Some things never change, even in the world of cryptos and Bitcoin. One of the main aspects that remains unchanged is Bitcoin’s price volatility.
Bitcoin’s price volatility was high in 2017 and it remains high today in 2021. The strong price movements up and down is a constant factor. At least for now. The price stability could change when the Bitcoin and cryptocurrency market become more established.
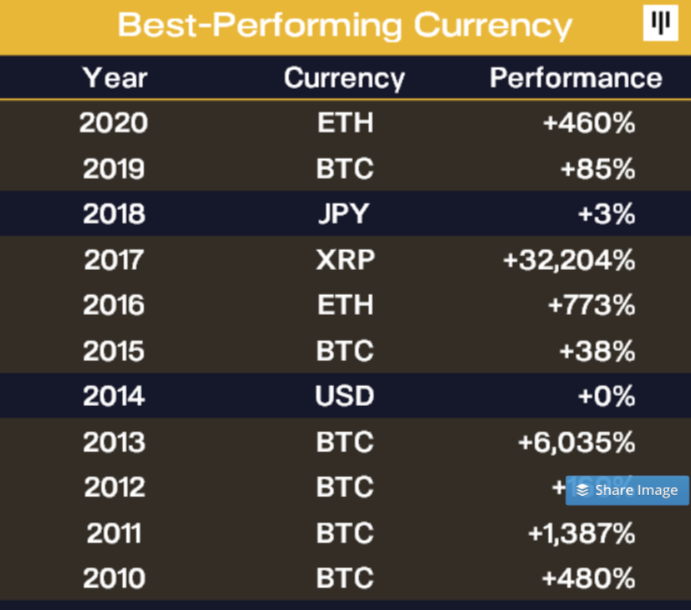
In the past 10 years, however, Bitcoin has been one of the best performing currencies (see image below).
Cycle and Impact of the Bitcoin Halving Process
Bitcoin works in an opposite logic when comparing it to fiat currencies or quantitative easing. AS time passes by, less and less Bitcoins are added to the global supply. And after the year 2140, no extra Bitcoins will be added at all. At that moment, the Bitcoin quantity will be the same and stay the same forever. The total circulation will be 21 million coins.
After every 4 years, the total number of Bitcoins that are available to mine (supply) will be cut in half. In the first four years there will be 10,500,000 coins created. The next four years after that will see 5,250,000 coins, then 2,625,000 coins, then 1,312,500 coins, etc.
This slowing down process is exactly the opposite of fiat currencies and quantitative easing, because central banks are continuously adding more money supply to the economy. The addition of money is often a good thing. Why? Because more money and low interest rates can help combat deflationary cycles and recessions. But this remains true as long as the economy remains in “balance” and does not overheat. Otherwise it could trigger high or hyper inflation levels. Bitcoin has more freedom than a fiat currency because it is not tied to one single economy or economic zone. In that way, Bitcoin is more similar to Gold, but with a clear finite and shrinking supply schedule.
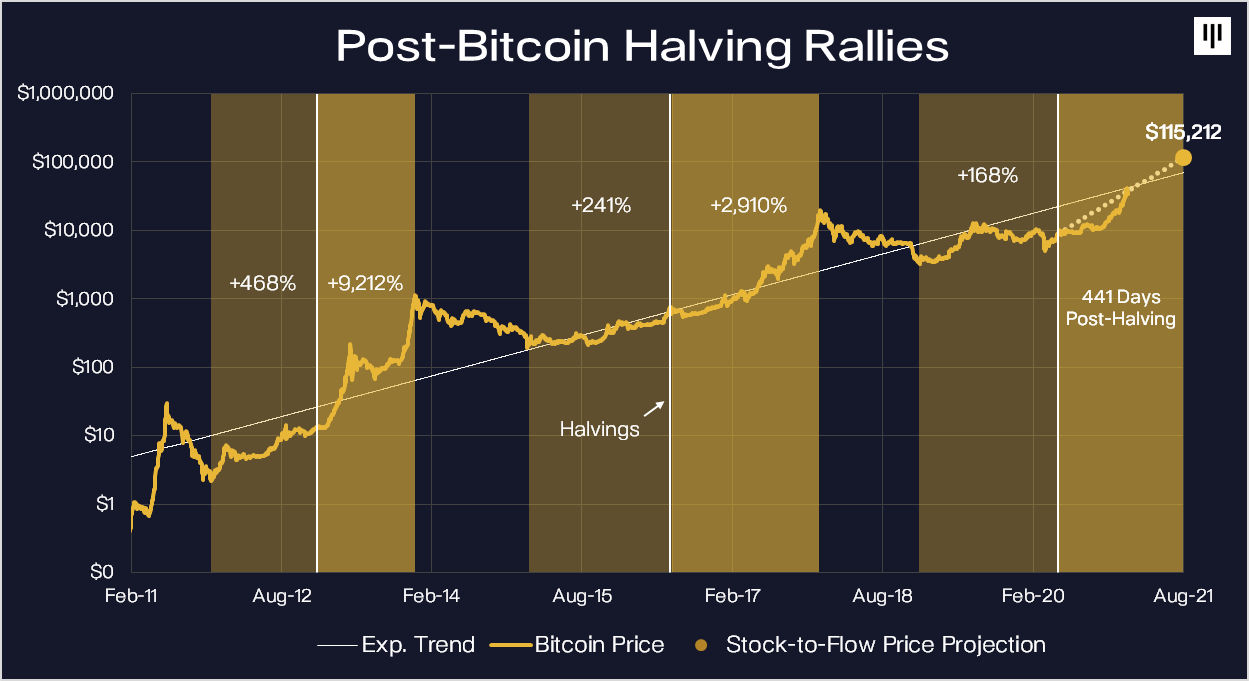
The decreasing supply has an impact on price. When the supply is cut in half, the price has usually increased after these halvings: “Bitcoin has historically bottomed 459 days prior to the halving. The price has then climbed leading into the halving date and then exploded to the upside afterwards. The post-halving rallies have averaged 446 days — from the halving to the peak of that bull cycle. In this cycle, the market did in fact trough 514 days before the halving. IF history were to repeat itself, bitcoin would peak in August 2021.” (Source Panteracapital)
Differences Between Bitcoin’s Uptrend in 2021 and 2017
Less ICO’s and More Value Based Investments
In 2017, the cryptocurrency market was all about ICOs, initial coin offerings. Buying Bitcoins offered investors a way into this market. Unfortunately for many investors, ICOs were very inflated and over-hyped. Many did not deliver even close to what was promised. The crypto bull runs 2017 vs 2021 was driven by ICO in 2017 and by Bitcoin and Ethereum in 2021.
When Bitcoin made its price peak in December 2017, it had only captured 39% of the market share of the industry. In the years 2020 and first quarter of 2021, Bitcoin’s share was much more dominant. Bitcoin had a market share above 70% at the start of 2021.
That said, this trend has reverted as well. Ethereum is grabbing some of that share since its strong surge started at the end of March 2021. At the start of May 2021, Bitcoin’s market cap share had fallen again below the 50% and stands at around 46%. This percentage is very volatile as the price movements remain large.
In any case, whether it is Bitcoin, Ethereum or other stable altcoins, the attention in 2021 is more on existing cryptocurrencies and their actual coin performance and characteristics rather than on ICOs and their white papers. In other words, more emphasis is placed on the current status of the coin rather than hopes and dreams of future coins.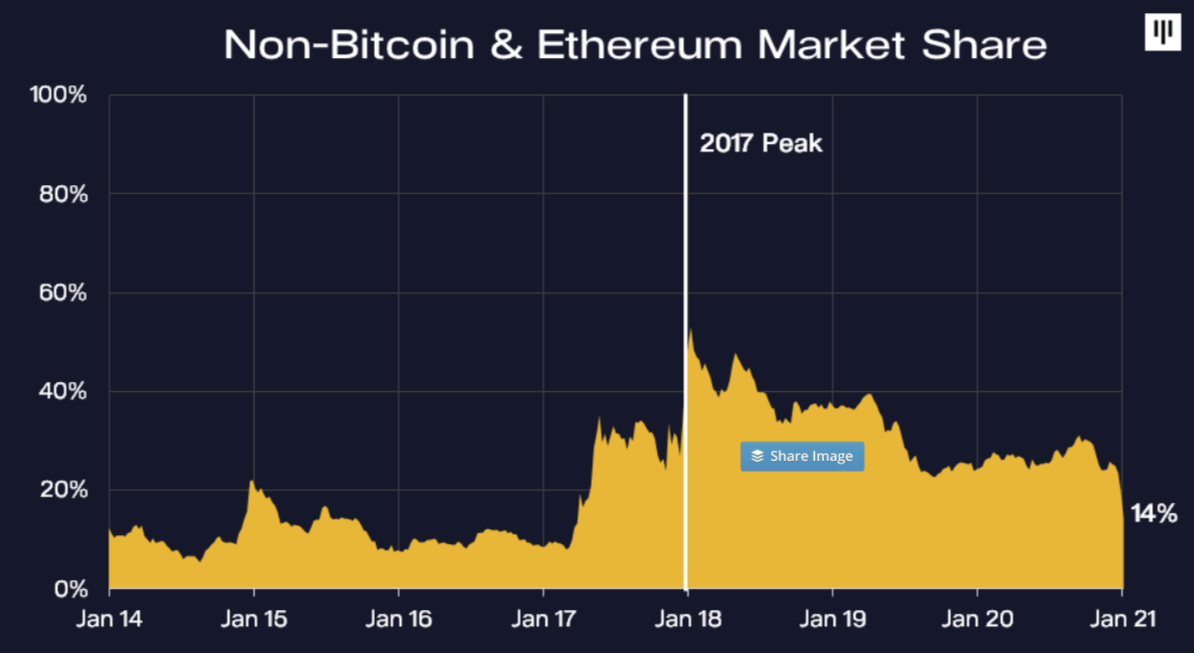
More Institutions, Companies, Billionaires, and Tweets?
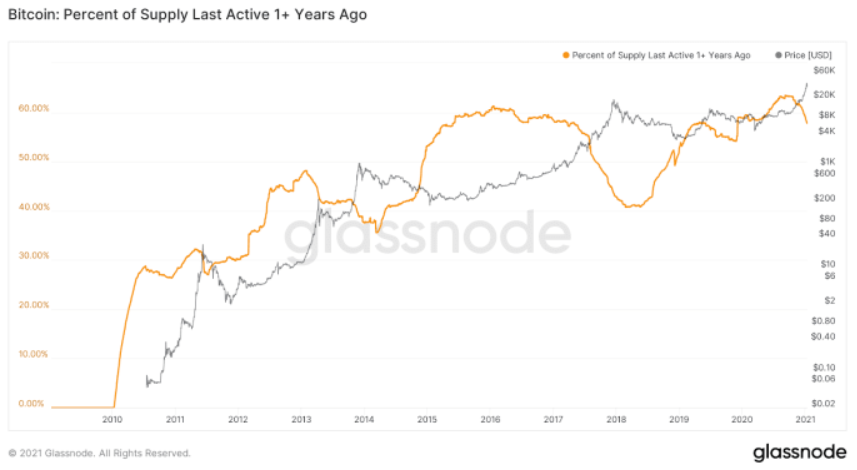
Bitcoin is not a coin anymore that you simply exchange for a pizza like in the previous decade. More and more Bitcoins are being used for investment purposes. They are not used or traded, but simply owned for investment purposes. According to Bitcoinmagazine, 61.31 percent of all Bitcoin in circulation has not been moved in over a year and less than 15 percent of it is actively traded on exchanges.
As the price is increasing, it seems to be squeezing out the average investor as well. Billionaires and companies seem to be the ones making the purchases in this rally. For instance, Tesla bought $1.5 billion in bitcoin in February 2021. Billionaire Michael Saylor recently announced more Bitcoin purchases as well.
More than 35 percent of institutional investors see value in bitcoin according to a Fidelity report from June 2020. These investors are also far less concerned about price volatility and market manipulation than they were before.
Last but not least, Bitcoin in specific and the cryptocurrency market in general seem to be heavily dependent on the tweets from Elon Musk. The Tesla CEO and billionaire is regularly sending his thoughts via tweets about the state of the cryptocurrencies. This is seemingly having a heavy impact on price volatility as his ideas and words are weighed. Negative looking comments are sending the price down lower whereas words of encouragement are sending it higher. This social media dependency is a new element for Bitcoin when compared to 2017 but perhaps could be gone with the next uptrend rally in perhaps the year 2025.
Conclusion Bitcoin 2021 vs 2017, 2013, 2011
The list of investors holding Bitcoin seems to be much larger now than ever before. Institutional investors, billionaires, and billionaire firms are not shy to invest billions in Bitcoin and Ethereum.
Although the price volatility and price patterns around the Bitcoin halvings seem to be the same, the focus of the market on Bitcoin and Ethereum from big names in the industry seems to be changing Bitcoin and Ethereum slowly but surely from a speculative asset to a true store of value, albeit one with large price swings.
For the uptrend to continue as the winner, price action will need to break above the 21 ema zone on the weekly chart. If not, then the uptrend seems to be really over. Traders can expect a retracement for the next couple of years until a new bull run might start at the end of 2023.
Good trading,
Chris Svorcik


It’s very informative review! Thank you!
Thank you Martynas!!
Thank you! Very informative article. I see you updated also with sept 21. Another update with January 2022 would be much appreciated. Once again thank you for all the efforts!!!!