GPB/USD At Decisive Level Or Still Confused?
Subscribe
Hi Trader,
Do you wonder what is happening with the GBP/USD?
Our article discusses 2 different scenarios: both are bearish in the long-term but have different consequences in the long run.
Scenario 1: Start GBP/USD Downtrend
Weekly Chart
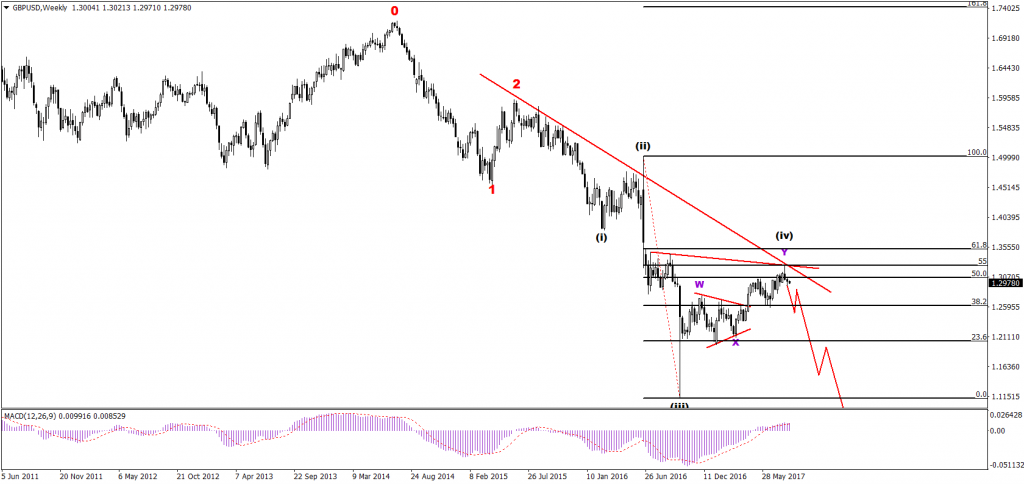
GBP/USD has developed a bullish corrective pattern within wave 4 (black), which seems to be completed considering the bearish price action on the lower time fames. This bullish correction could be part of larger downtrend and a potential wave 5 (black) of a larger wave 3 (red) could have already started. Another argument for the restart of the downtrend is that price respected the resistance trend lines (red).
4 Hour Chart
On the 4 hour chart the wave 4 (black) is decomposed of WXY (blue), which itself is built of 3 seperate ABC (green). This indicates that the structure seems to be completed. By drawing the Fibonacci retracement tool (as shown in the image above), you can see that the price has bounced at the 50-61.8% Fib resistance zone.
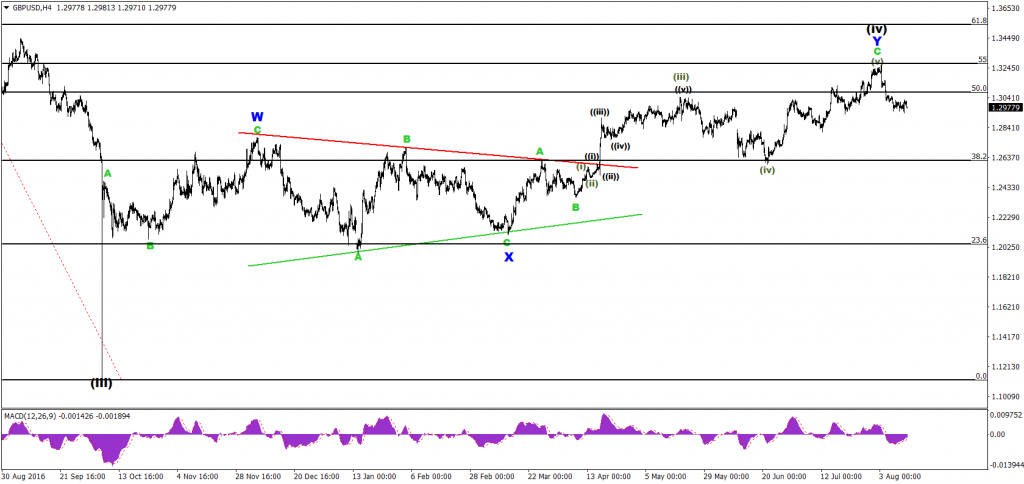
Image 4 Hour Chart GBP/USD
.
1 Hour Chart
The GBP/USD could be building a wave 4 (pink) with 3 internal WXY waves (red). The break below 1.2940 could see the start of wave 5 (pink), which could complete the wave 1 of a larger cycle.
At the moment, price has respected the 38.2% Fibonacci level, which is typical for a wave 4 (pink). The invalidation level of wave 4 (pink) is bottom of wave 1 (pink), although a break above the 61.8% Fib level makes a wave 4 unlikely.
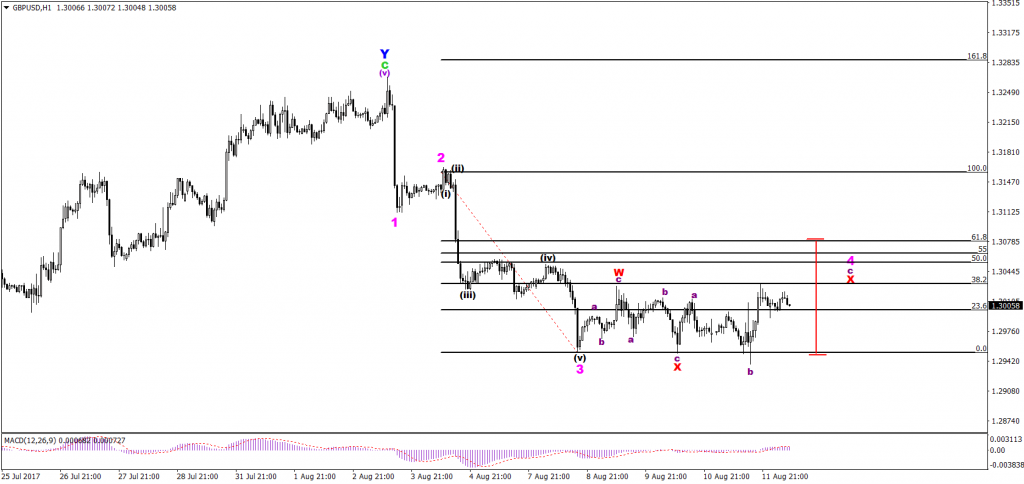
Image 1 Hour Chart GBP/USD
Scenario 2: Bullish Wave 5 Remaining
Daily Chart
The alternative scenario is that wave 4 (black) hasn’t been completed. In that case, the wave 4 (black) retracement could still be active via a potential ABC (Green). In this scenario, the GBP/USD could have completed the wave 3 (blue) and price is now in a wave 4 (blue). That would mean one more push to complete the wave 5 of the wave C (green). The break of FE 61.8 level @ 1.2680 may suggest the invalidation of this wave count.
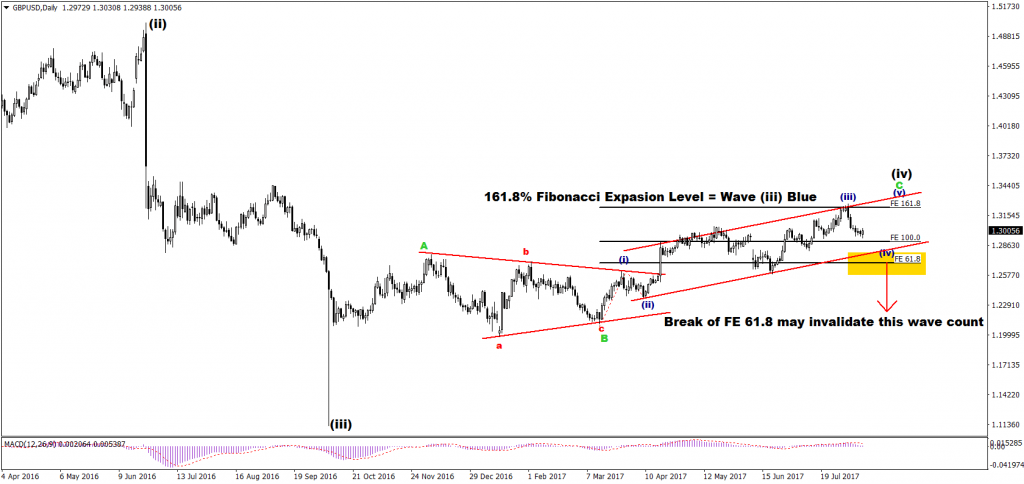
Image Daily Chart GBP/USD
Many green pips,
Elite CurrenSea team
More info on our ecs.SWAT course and trading system
Twitter: @EliteCurrenSea
YouTube: Elite CurrenSea


Leave a Reply