✅ S&P500 Breakout Confirms Bullish Continuation via Waves 4-5 ✅
Subscribe
Hi traders,
The S&P 500 is staying above the broken resistance trend line and short-term moving averages, which is indicating that an uptrend is likely to continue higher and challenge the previous top.
S&P500
Day
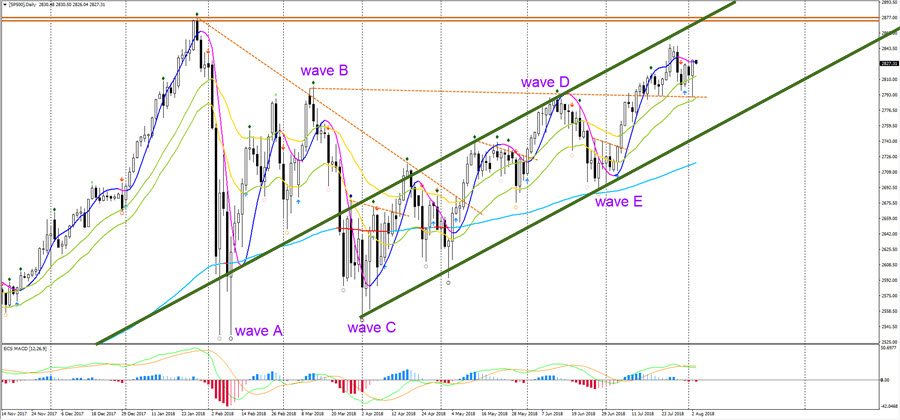
S&P 500 completed a contracting triangle pattern via an ABCDE (purple) wave pattern. The moving averages are neatly aligned and price is looking to push higher as long as price stays in the uptrend channel, which is indicated by the green channel lines.
4 hour
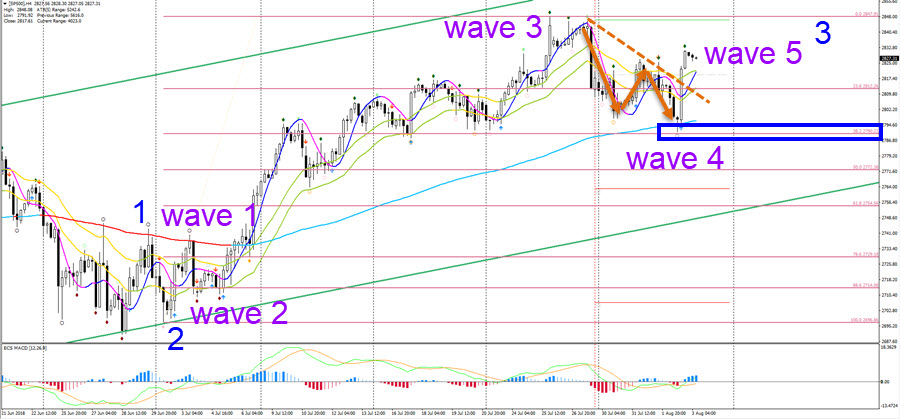
On a lower time frame, the S&P 500 seems to have completed a wave 3 (purple) which was then followed by a 3 wave corrective pattern (orange arrows). The correction is probably part of a wave 4 (purple) when considering the strong bullish bounce at the 38.2% Fibonacci support zone. The bullish breakout above the resistance trend line (dotted orange) seems to be confirming the potential for a wave 5 (purple) of a wave 3 (blue).
Good trading,
Chris Svorcik
Elite CurrenSea


Leave a Reply