? Critical Wave Patterns Visible ? for EUR/JPY, GBP/AUD and XAU/USD
Subscribe
Dear traders,
for the first time, we share our wave analysis on the EUR/JPY, GBP/AUD and XAU/USD 4 hour charts with you.
The GBP/AUD and XAU/USD pairs seem to be ready to build a key wave C within a larger ABC zigzag whereas the EUR/JPY remains right at the invalidation level of a wave 4.
GBP/AUD Bearish ABC Zigzag
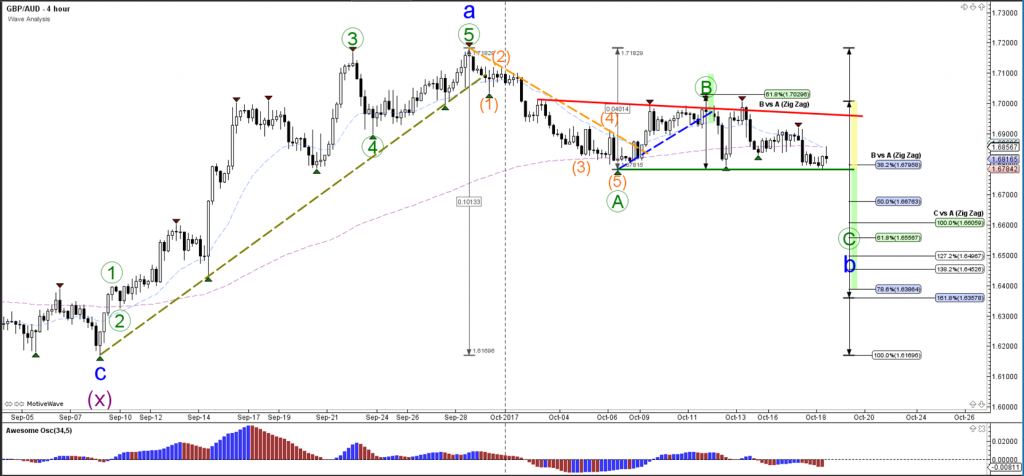
The GBP/AUD is building a sideways zone after the bullish price action was unable to break above the 61.8% Fibonacci resistance level of wave B.
A bearish break could start wave C (green) whereas a bullish breakout could start a new bullish structure and potentially invalidate the wave patterns shown in the image.
For more wave pattens and analysis, make sure to join our 2 week free trial for ecs.LIVE.
123.
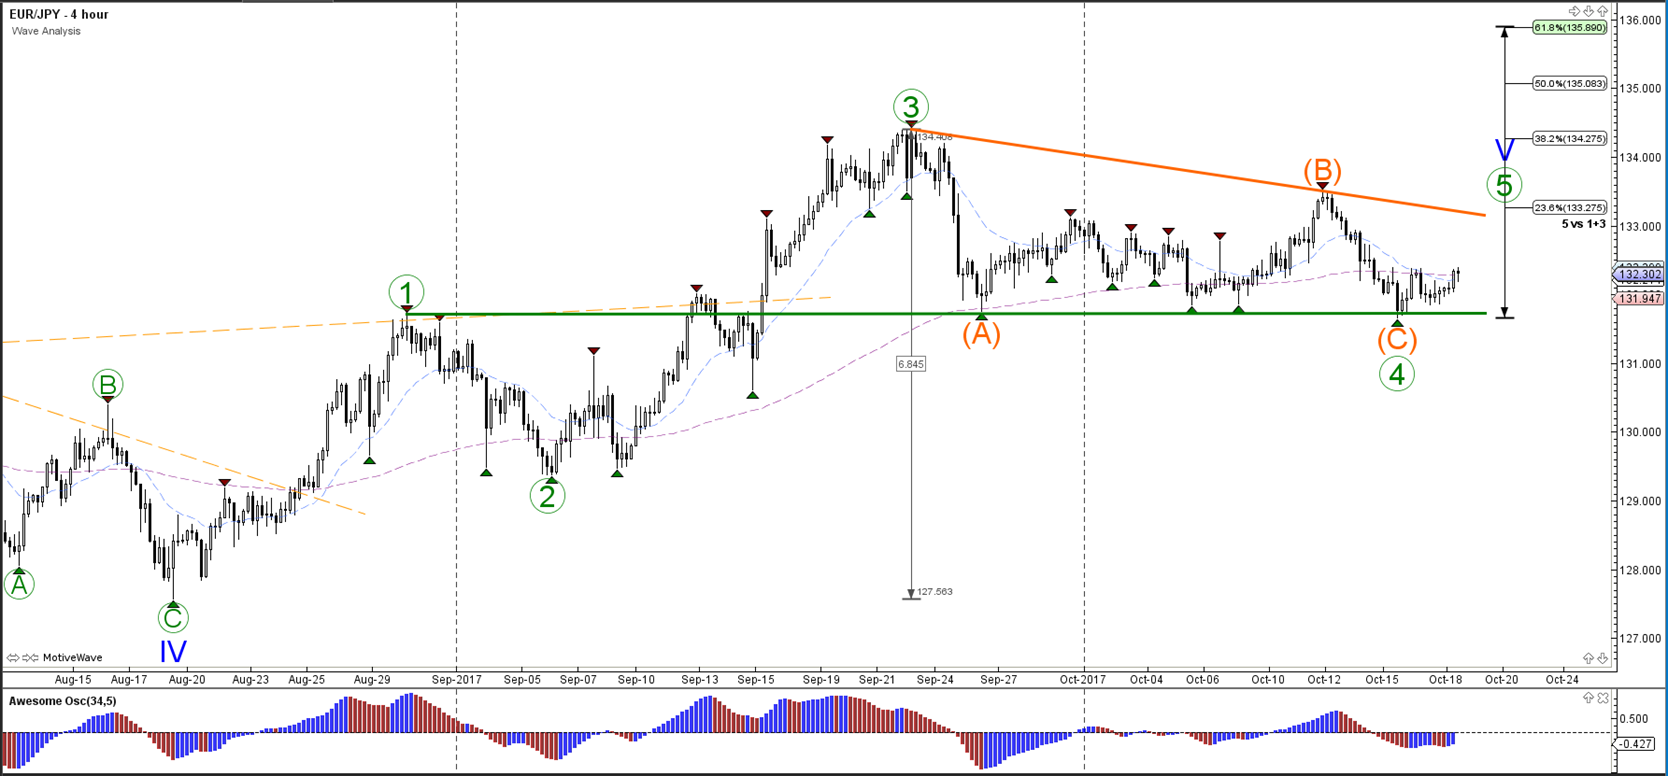
EUR/JPY ABC Completed in Wave 4
The EUR/JPY seems to have completed an ABC (orange) within wave 4 (green) but a break below the support trend line (green) would invalidate this wave pattern. A break above the resistance trend line (orange) would confirm a potential bullish breakout within the waves 5.
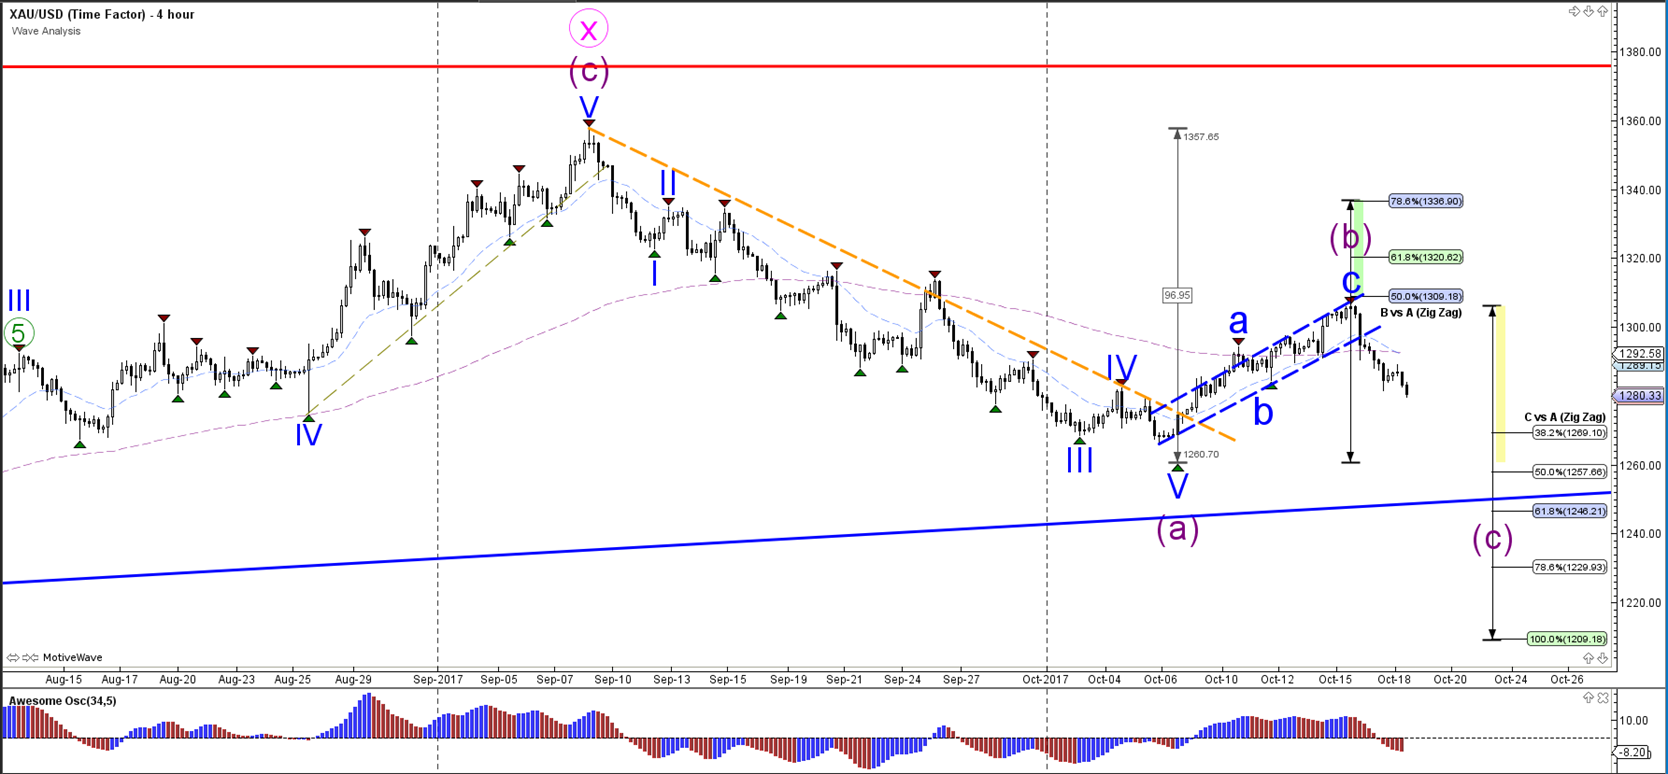
XAU/USD Breaks Below Channel at 50% Fib
The XAU/USD broke below the bullish channel (dotted blue) and could have completed the wave B (purple) and started the bearish wave C (purple).
Many green pips,
Chris


Leave a Reply