Bitcoin (BTC/USD) Approaches Resistance ? Reversal Chart Pattern 〽️
Subscribe
Dear Traders,
the Bitcoin (BTC) uptrend versus the US Dollar (USD) seems to be an endless continuation of higher highs and higher lows.
But classical technical analysis can still warn us traders of retracements within the trend, continuation chart patterns and even reversal chart patterns.
In today’s market we can see that BTC/USD is approaching a potential resistance zone which could cause a reversal chart pattern.
BTC/USD Builds H&S Reversal Pattern
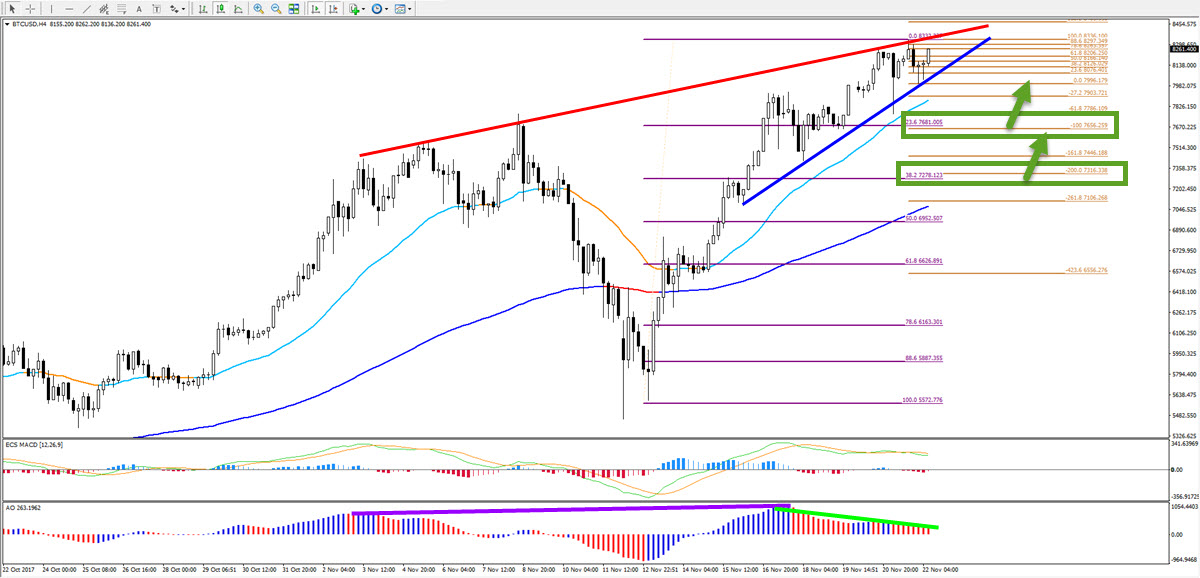
The uptrend has been so strong that discussing a pullback almost seems like wishful thinking. But if our technical analysis is correct then the BTC/USD uptrend on the 1 and 4 hour charts are showing signs of struggle.
Here is our quick summary:
- Multiple divergence between the 1 hour tops (see image below)
- Multiple divergence between the recent 4 hour tops (green line)
- Potential Head and Shoulders reversal chart pattern (see image below)
- No divergence on the 4 hour chart between the bigger tops (purple line)
- Reversal rising wedge chart pattern (red/blue lines)
Reversal trades are often very risky when trading against a strong trend. And BTC/USD can certainly be considered a strong uptrend.
In these circumstances the best trade setups are actually with the trend. A break of the continuation chart pattern for example is an excellent way of entering the trend and catching part of the upside.
There are multiple pros and cons of trading Bitcoin, but personally I would not be looking for a bearish trade on Bitcoin or BTC/USD anytime soon… but I do think that analysing how far price could retrace makes sense – if it does retrace.

Potential Bitcoin Trade Setups
Waiting for larger pullbacks to occur occasionally does provide good entry spots.
If the H&S pattern does indeed take place at resistance then price could build a bearish retracement back to lower support levels around $7700 or $7250.
These levels in turn could act as bouncing spots for the uptrend to continue towards the next psychological round level of $10,000 (10k).
Of course, if price does break above the top then will need to wait for a new uptrend continuation pattern to emerge. The main target for the moment remains 10k.
Wish you good trading,
Chris Svorcik
.


Leave a Reply