GBP/USD ?Triangle Breakout ?Signals Bullish Continuation
Subscribe
Dear Trader,
the GBP/USD has been in yet another long and complex correction.
But price-action is showing signs of a potential end, and the start of a bullish trend continuation.
This analysis will take a closer look at the most recent developments of the GBP/USD.
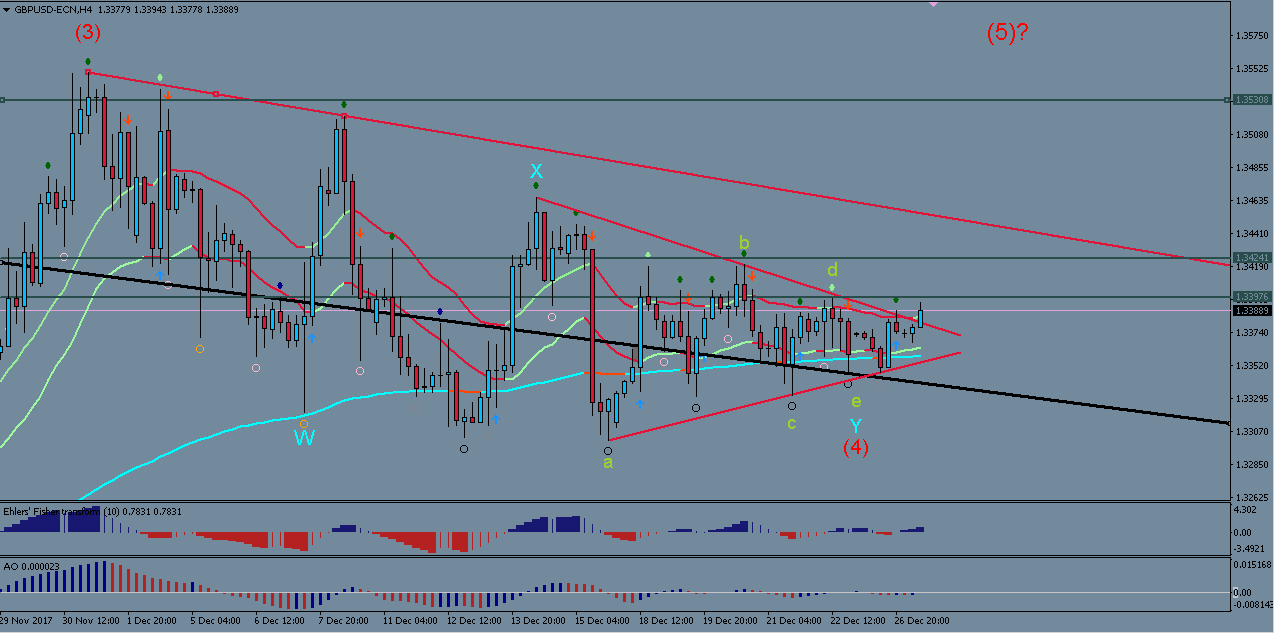
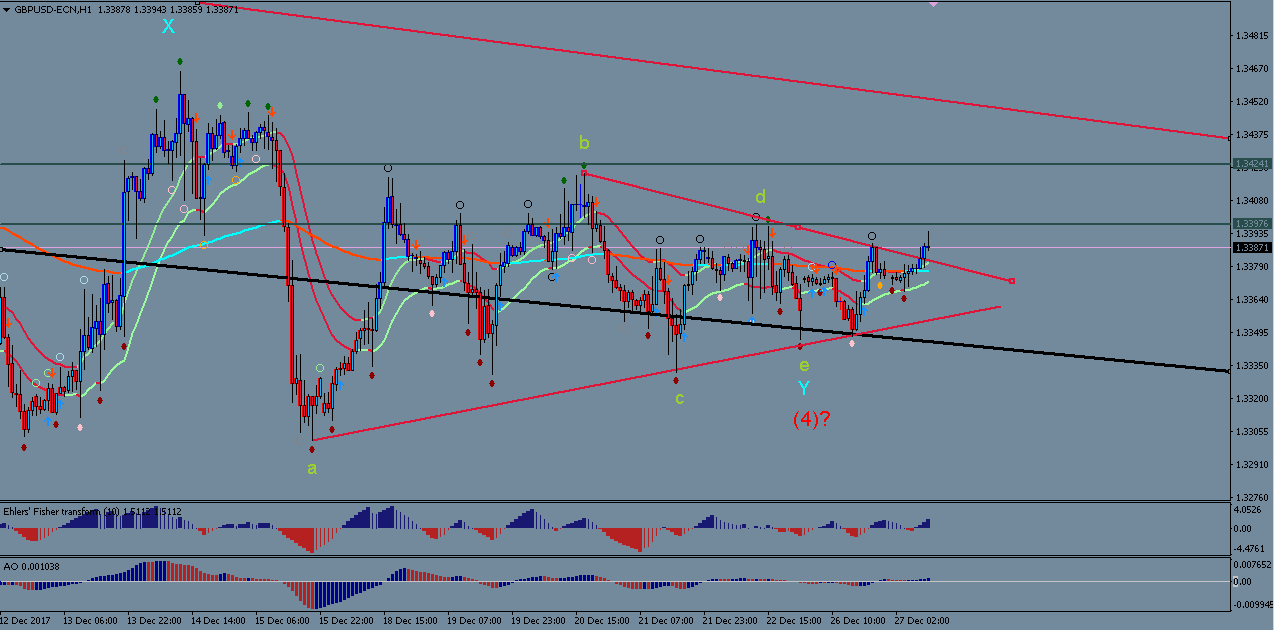
Correction Has Culminated in Triangle
The images below show the bearish correction in which the Cable has been throughout the whole of December. So far the price-action fits well into a complex double correction (WXY), which is culminating in a triangle (green a,b,c,d,e).
Bullish Break Suggests Trend Continuation
Price broke the triangle to the upside in the last few hours, which suggests that the correction may be over and that a final Wave 5 upwards could have begun. If this is true, then we should see price continue upwards with fairly strong momentum from now on and, eventually, also a break of the Dec 1st high.
Possibility of Further Correction Remains
In spite of the bullish break, the fact is that a lot of resistance levels remain in the way of a GBP rally. The possibility of an even more complex correction remains therefore. If this were the case, the price structure over the next days would form a bullish ABC that could test levels of up to 1.3450 before going into yet another bearish ABC.
The key will lie in the nature of the price-action in the coming days… i.e. will it show fairly consistent impulsiveness (Wave 5 scenario) or show more erratic ups and downs (extended correction scenario)
There could be long entry opportunities in both scenarios, but caution is required due to the many resistance levels along the way.
All the best along your trading journey…
Hubert
Follow Hubert on Twitter
.


Leave a Reply