NASDAQ ? Ready to Sell the Rallies???
February 12, 2018
3 min read
Subscribe

Dear Traders,
The big news of last week was no doubt the equities sell-off.
Things are looking shaky for US indices and the question is whether or not there are any tradable setups on the horizon.
This analysis will take a quick look at the NASDAQ and highlight potential trade opportunities in the near future.
Top Could be in Place
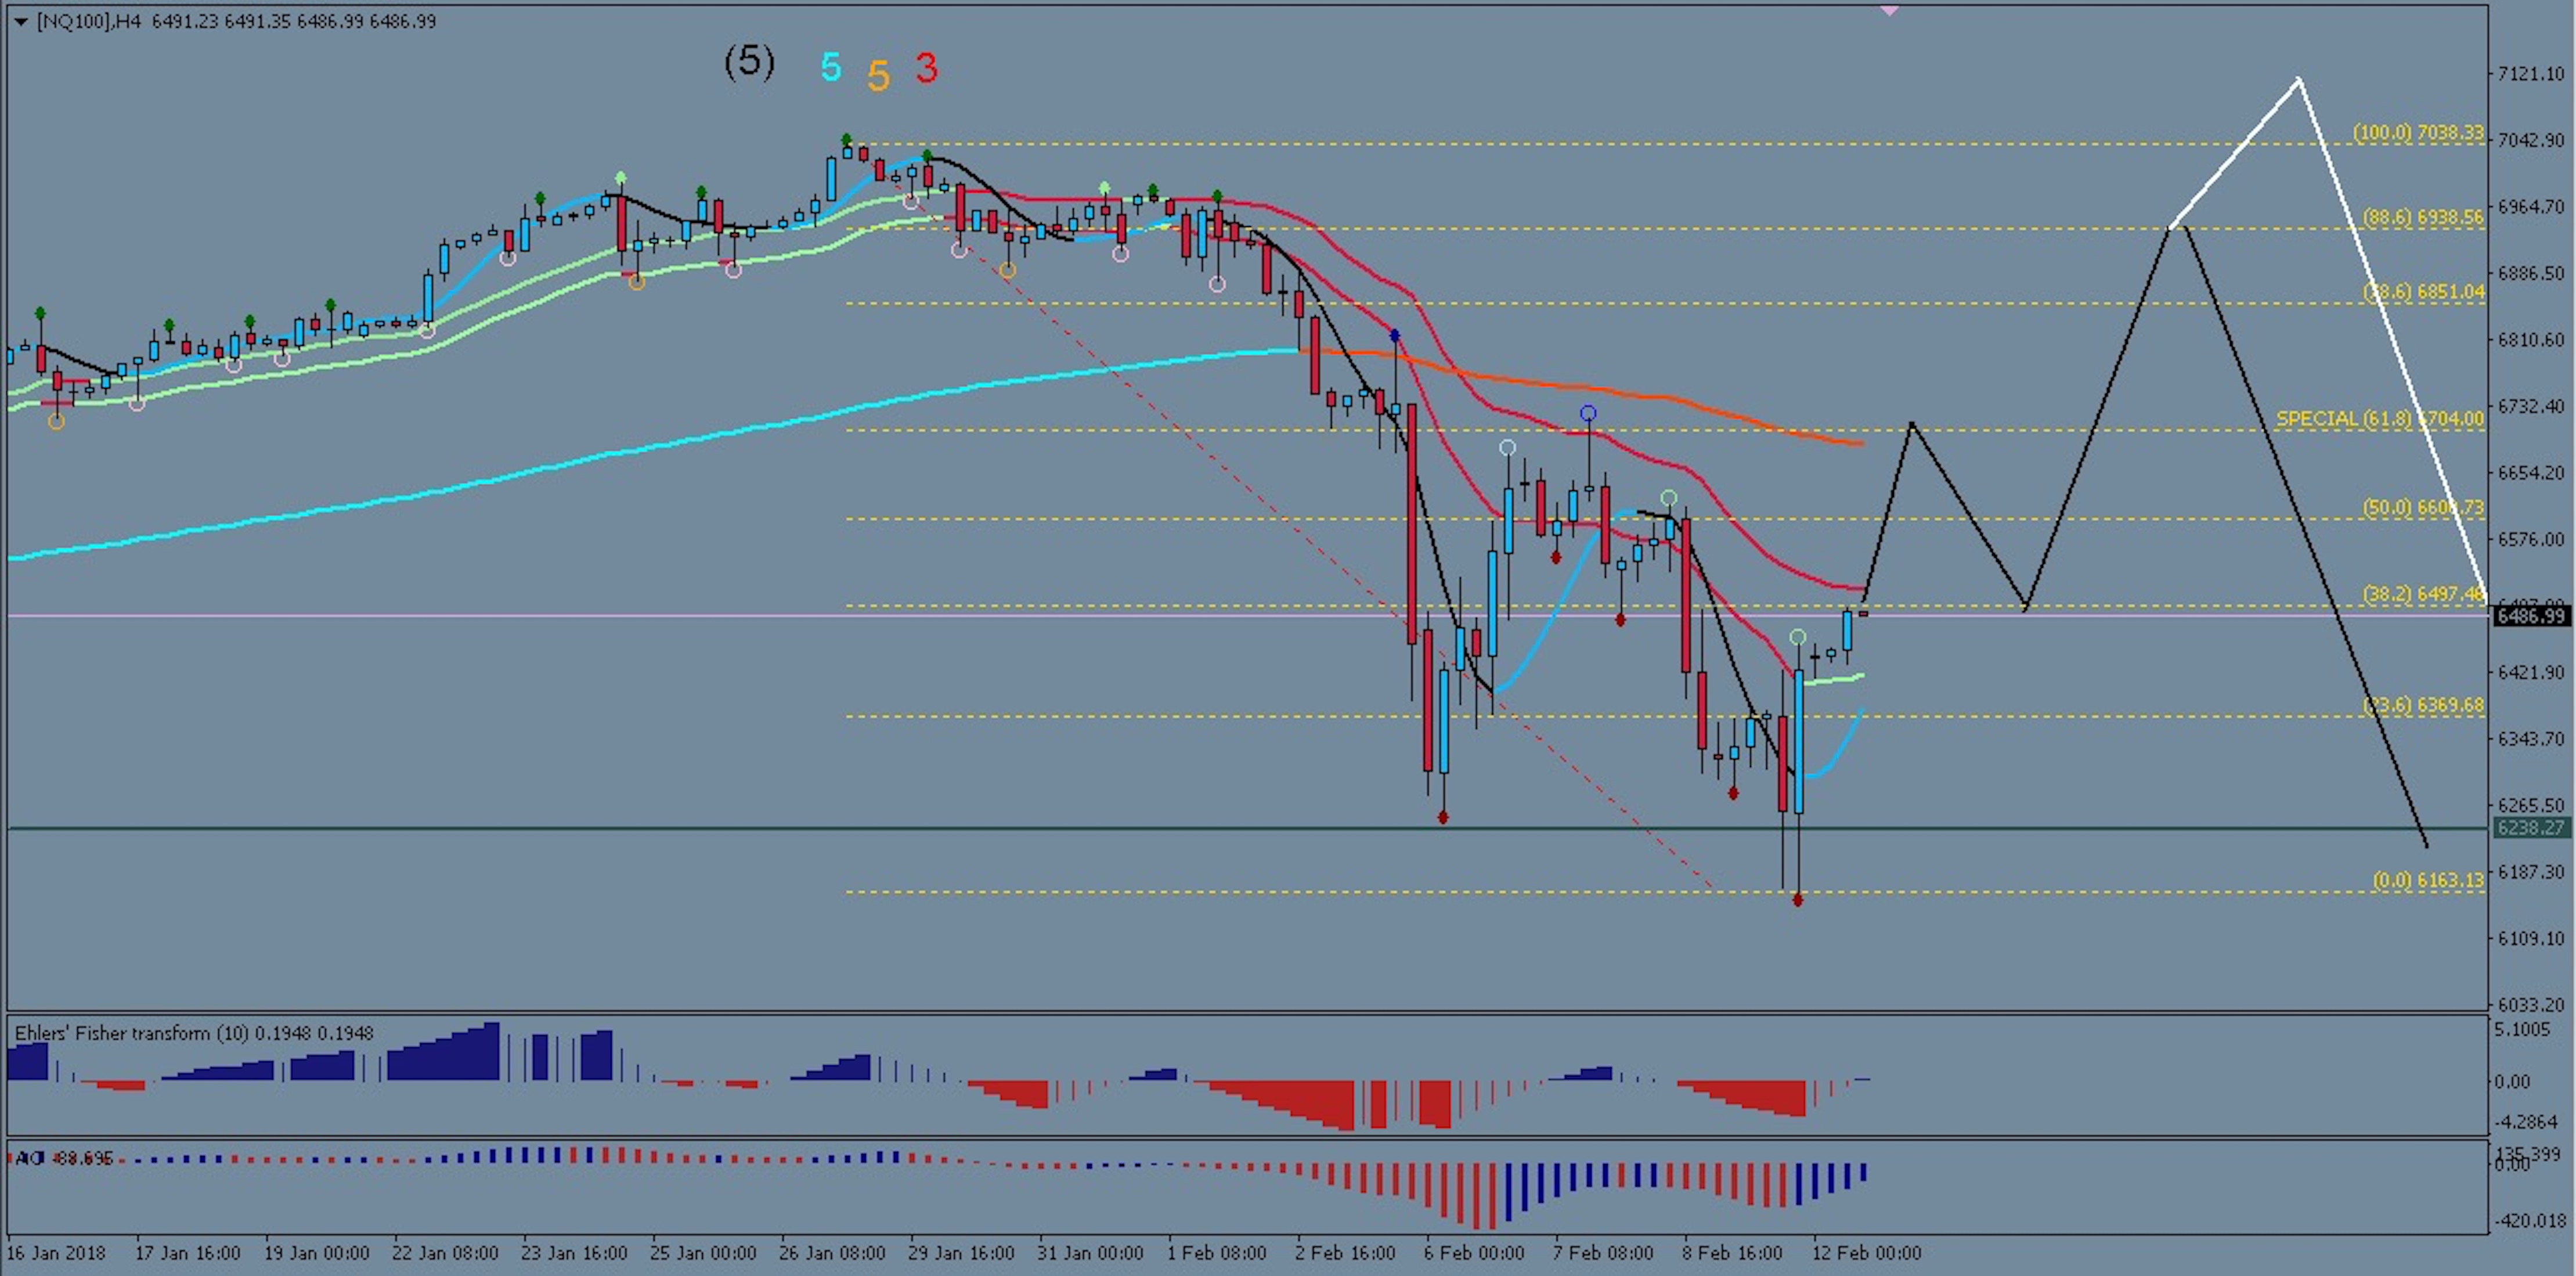
The bearish price action of last week could well have marked the completion of multiple degrees of waves of the NASDAQ’s bullish trend. A deeper correction has now become much more likely.
Sell opportunities could be just around the corner. Here is what we are looking for:
- Although a bullish pullback is to be expected over the next few days, there is a good chance that new record highs will NOT be achieved anymore.
- Watch out for some kind of 3 wave bullish corrective structure to form over the coming trading week, which would add further weight for a bearish scenario.
- Watch out for bearish price reactions at any fib level (but most likely at the 61.8% and deeper). Key zones to watch out for in this regard are 6700 and 7000. A 4-hour candle close that strongly breaks back below the 21 EMA within this price zone could be early signals for bearish continuation.
- There is a realistic chance that the NASDAQ could fall as low as 4000, which is the price level of Wave 4 of one lower degree. But don’t expect this to happen in one swing. Some kind of large complex corrective structure should be forming on its way down to these low levels.
- If price breaks above the last high of 7038, do not expect too much more upside either. We may see a small higher high in that case, but this should quickly break down again if the wave analysis is correct.
All the best along your trading journey…
Hubert

.


Leave a Reply