USD/JPY Nail Biter When Approaching 115 Resistance Zone ?
Subscribe
Dear Traders,
the USD/JPY has been fighting against resistance for a while but is struggling to break above the 114.50-115 resistance zone.
Will the USD/JPY uptrend be able to show a bullish break or will there be a reversal?
Time for a closer look on the USD/JPY.
3rd Approach of 115 Resistance Zone
The USD/JPY has been in a lengthy sideways range on the daily chart and is now approaching the resistance zone for the 3rd time. There are two main factors why a breakout could occur:
- Typically the importance of a support or resistance (S&R) level decreases as price approaches such a S&R level more often, which this makes a breakout more likely.
- Also, the USD/JPY is in a clear uptrend: the moving averages are clearly being pulled away from each other.
But in my view, the USD/JPY is more likely to break with the next attempt rather than with the current move up. Let’s explain why.
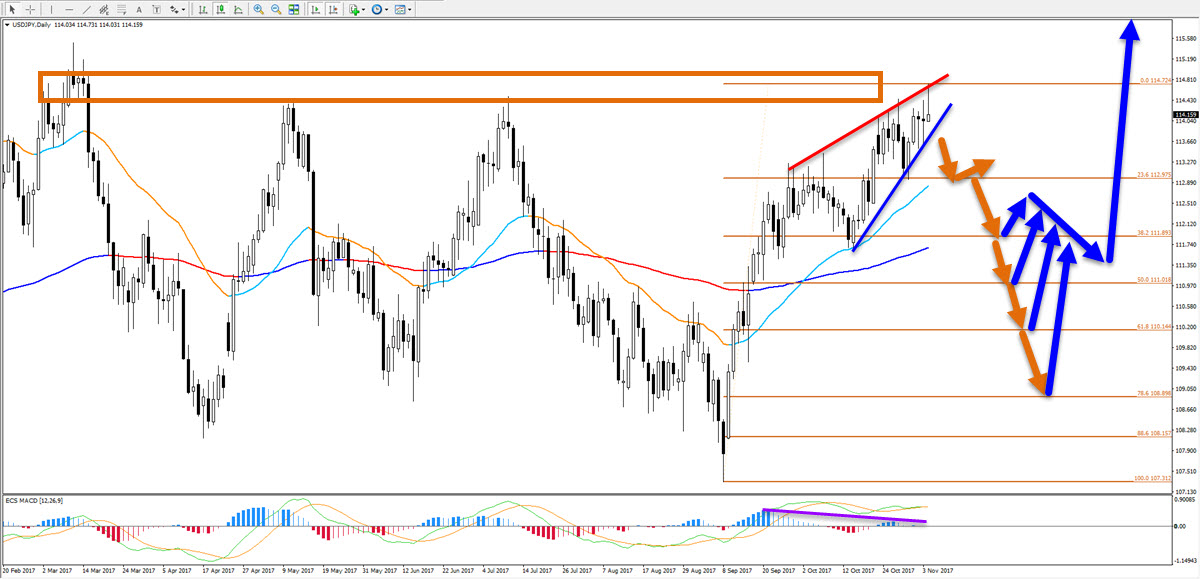
Bearish Bounce as Retracement
There are 2 main reasons why I am expecting a bearish bounce rather than a bullish breakout:
- Divergence between the tops (purple line on ECS MACD)
- Rising wedge chart pattern (blue/red lines)
Confirmation and Target
The confirmation of such a bearish bounce could occur this week if there is a strong bearish daily candle visible. A closer near the low with a big wick on top of the candle could already indicate the end of the bullish run. But the real confirmation occurs when price breaks below support of the rising wedge (blue).
A bearish breakout (orange arrows) could take price down to the Fibonacci levels, which in turn acount as support (blue arrows). I do expect price to bounce at the 38.2-61.8% Fib zone for a continuation of the uptrend. And this time resistance should break.
The entire analysis is invalidated if price shows a strong bullish daily candle breaking above 115 and closing near the high. In that case, a bullish breakout seems more likely.
Good trading,
Chris Svorcik
.


Leave a Reply