WTI – Technicals Favor Bearish Continuation

Dear Traders,
WTI is trading at interesting price levels, which present a good trade setup opportunity. Today’s post will provide a technical analysis of WTI and a potential trade setup.
Very Bearish Techincals
WTI made a sizeable recovery over the last few trading days, after it had plunged from its lofty heights during late May and June. However technicals remain very bearish for crude oil. Here is what I see:
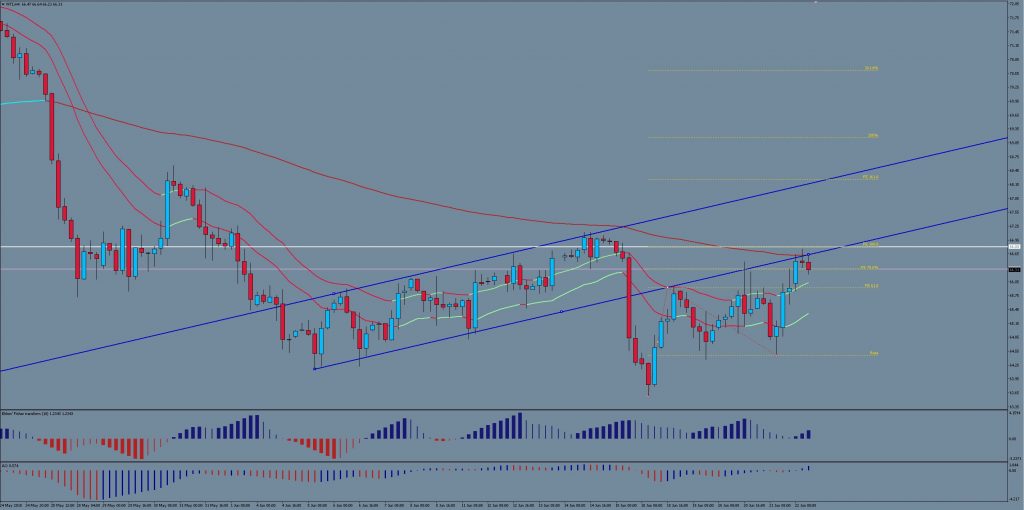
- Price has established a solid bearish alignment of the long-term and short-term moving averages of the 4-hour hart (see above), while also trading below the short term EMA of the daily chart.
- In addition, price dropped below an important r/s level around 66.80, which was the first bearish turning spot back in January 2018 which lasted for 3 months before it was broken to the upside again. Trading below this level again suggests potentially more bearish pressure ahead.
- Momentum remains strongest to the downside, in spite of decent pullbacks.
- Price-action since the June 18 low looks more corrective than impulsive and is currently still fitting into an Elliott Wave zigzag correction very well , i.e. price retraced within a gently upwards-sloping channel and the current price levels appear to be encountering resistance at the 100% Fibonacci extension of what could have been wave A, which is a classic signature for zigzags.
- Furthermore price has now retraced back to the 144 EMA of the 4 hour chart, which is building a POC resistance zone in conjunction with the daily chart 21 EMA, the key r/s level of 66.80 and a retest of the broken channel line (see blue channel in chart above).
Overall a lot more factors speak for a bearish continuation at this point in time, which presents an interesting trade setup potential.
The next bearish move needs to start soon (probably during today’s NY session) in order for sellers to remain in control. The invalidation level of the bearish scenario is lying very close to the current price, i.e. around 67.50, which is just above the previous high of June 14. A bullish break of this level would mean that price managed to climb above the key r/s level of 66.80 and above the 144EMA, which would make a downwards move a lot less likely. At the same time target levels lie a good distance away, around 63 – 62.85 which acted as a previous support.
This makes for a good reward to risk ratio setup
All the best along your trading journey.
Hubert


Leave a Reply