〽️ AUD/USD Bears Aim for Full Downtrend Below 0.6750 〽️
Subscribe
Hi traders,
the AUD/USD downtrend is close to testing the key support trend line (blue) from the previous bottoms. What is next for the AUD/USD pair?
USD/JPY
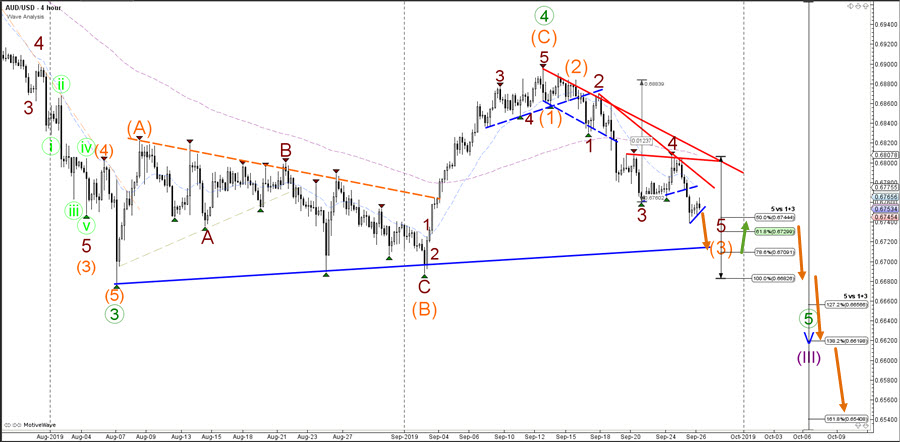
4 hour
A break below that support line (blue) could send the AUD/USD below the previous bottoms and towards the Fibonacci targets of wave 5 vs 1+3 for a strong downtrend continuation. A bullish bounce could send the currency pair back to the resistance trend lines (red).
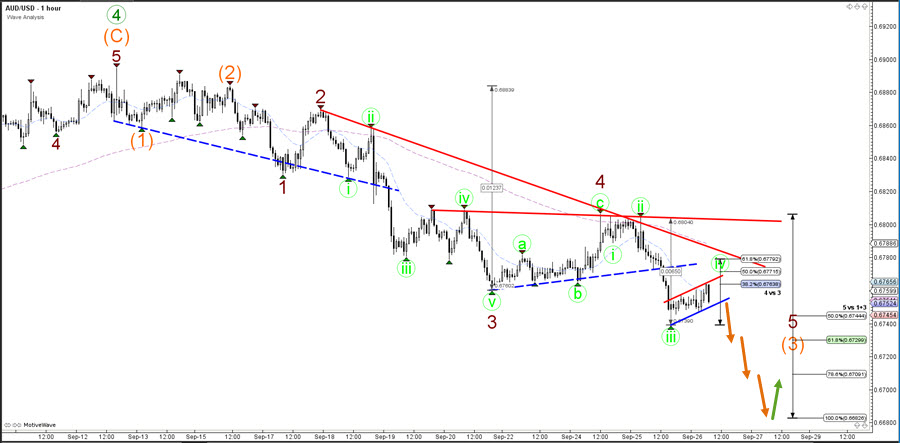
1 hour
The AUD/USD completed a bullish ABC (green) pattern within wave 4 (dark red) and then broke the support trend line (dotted blue) for a bearish breakout. The current bear flag chart pattern indicates a potential downtrend continuation, which is typical for a wave 4 (light green) pattern as long as price stays below the 61.8% Fibonacci resistance.
For more daily wave analysis and updates, sign-up up to our ecs.LIVE channel.
Good trading,
Chris Svorcik Elite CurrenSea


Leave a Reply