AUD/USD and DAX Indicate Bullish Wave 3-4 Structure
Subscribe
Hi Traders, curious if there are any interesting wave patterns visible in the financial markets?
Even though the northern hemisphere is currently in the midst of its peak summer time (mid August), the Forex market in specific and financial markets in general are still showing decent volatility and price movement.
Today we share our analysis with you and take a closer look at the AUD/USD and DAX 30 – the 2 videos summarizing this article are shared at the very bottom.
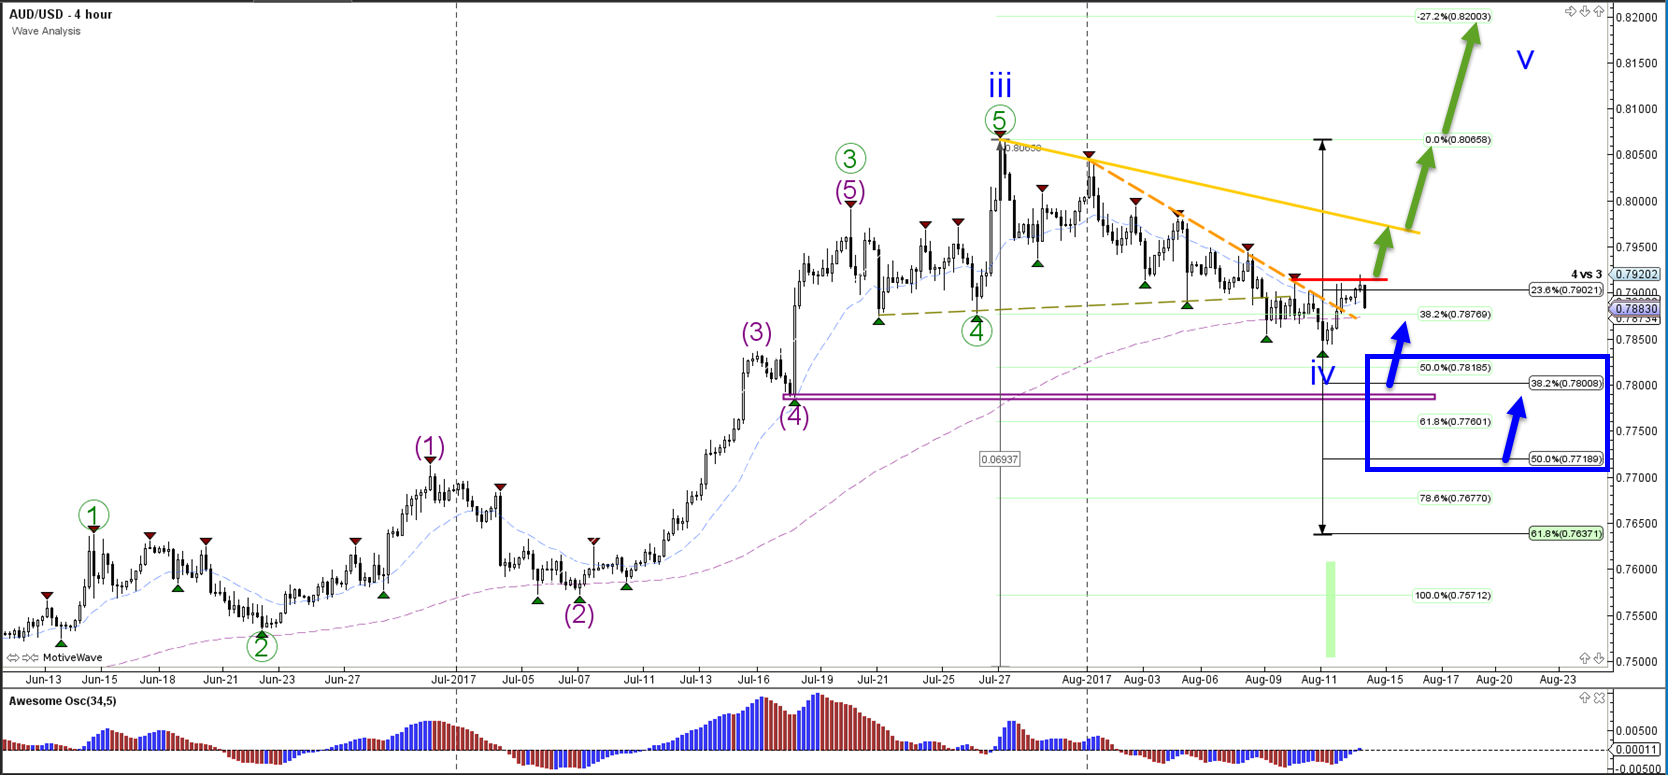
AUD/USD Bullish Bounce?
The 4 hour chart of the AUD/USD is bullish due to the strong momentum and slow bearish bearish correction. This is a typical wave 3 and 4 pattern and indicates that one more bullish is possible and even likely.
Whether the wave 4 correction (blue) has been completed remains to be seen. Price did manage to break above the resistance trend line (dotted orange)… But the failure to set a new higher high makes it vulnerable to a larger bearish correction.
Here are the 2 most interesting trade setups:
- A larger correction could price fall towards the support zone which is indicated by the blue box. A bullish bounce (blue arrows) anywhere between 0.77 and 0.7825 is possible. Particularly the support level (purple box) of a minor wave 4 could provide extra support.
- A bullish breakout above the resistance (red) could price challenge the next resistance (orange). If the bullish momentum manages to keep in control, price could continue towards the previous top at 0.8066 (0.0%) and then towards the -27.2% target at 0.82.
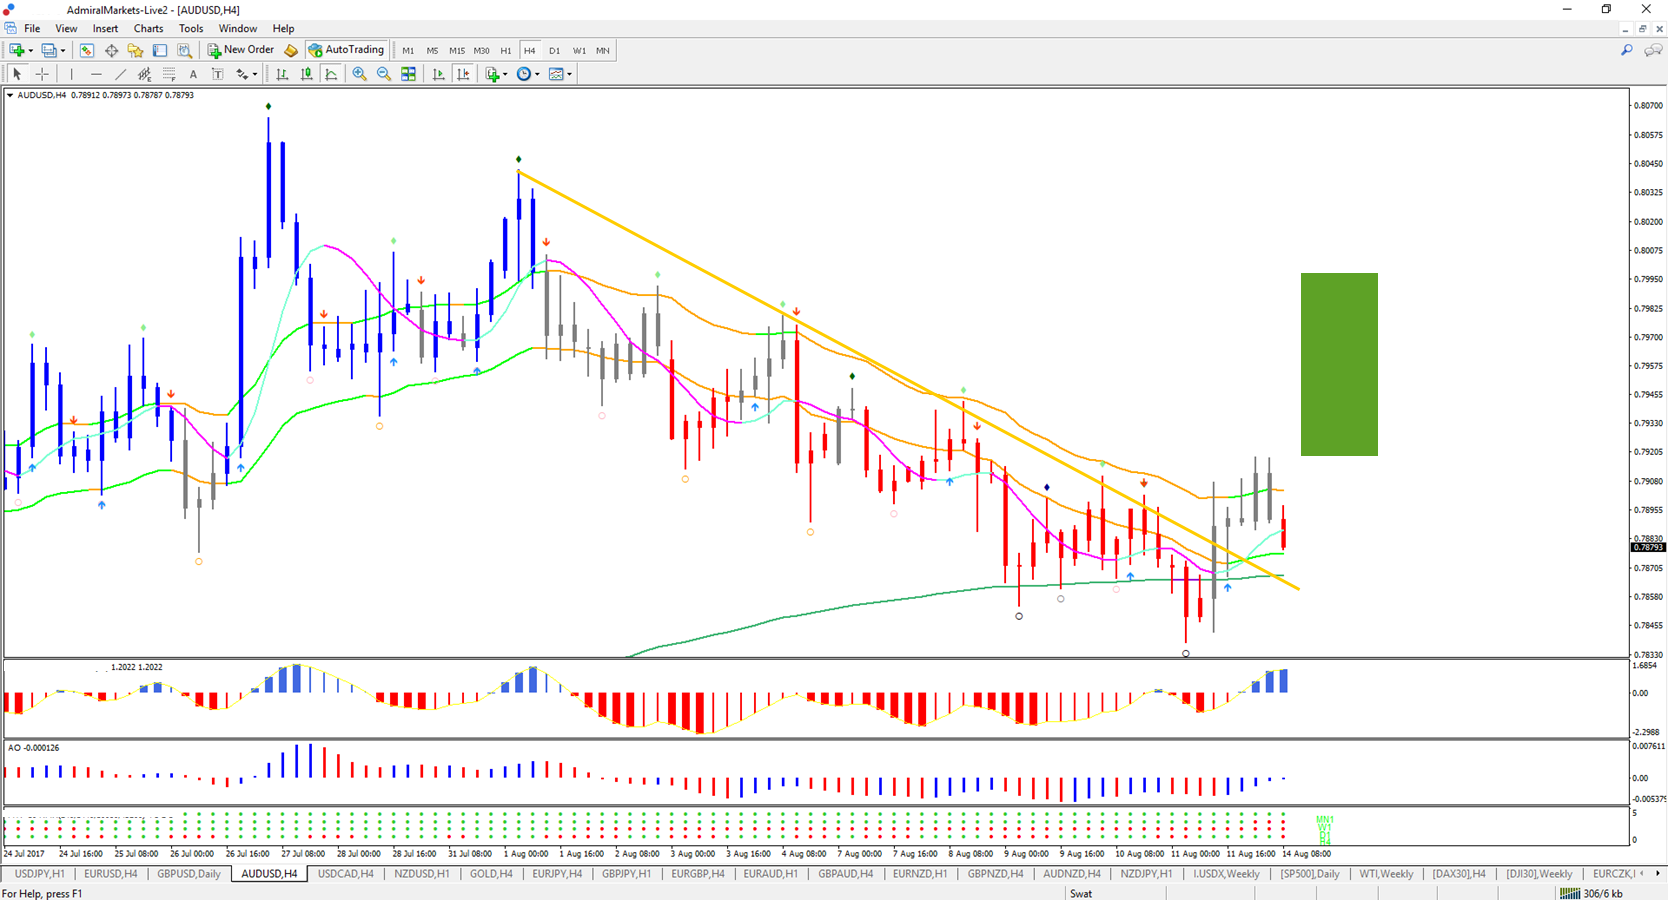
If wave patterns seems complex to you, then another way of viewing the charts via our ecs.SWAT method. The template shows that price is being squeezed in between the long-term and short-term moving averages.
A breakout to the upside prefered as the MAs are bullish aligned but the trigger candle has not yet been confirmed. A setup seems ready once a blue trigger candle becomes visible (like the blue candles on the left) in the breakout zone (green box).
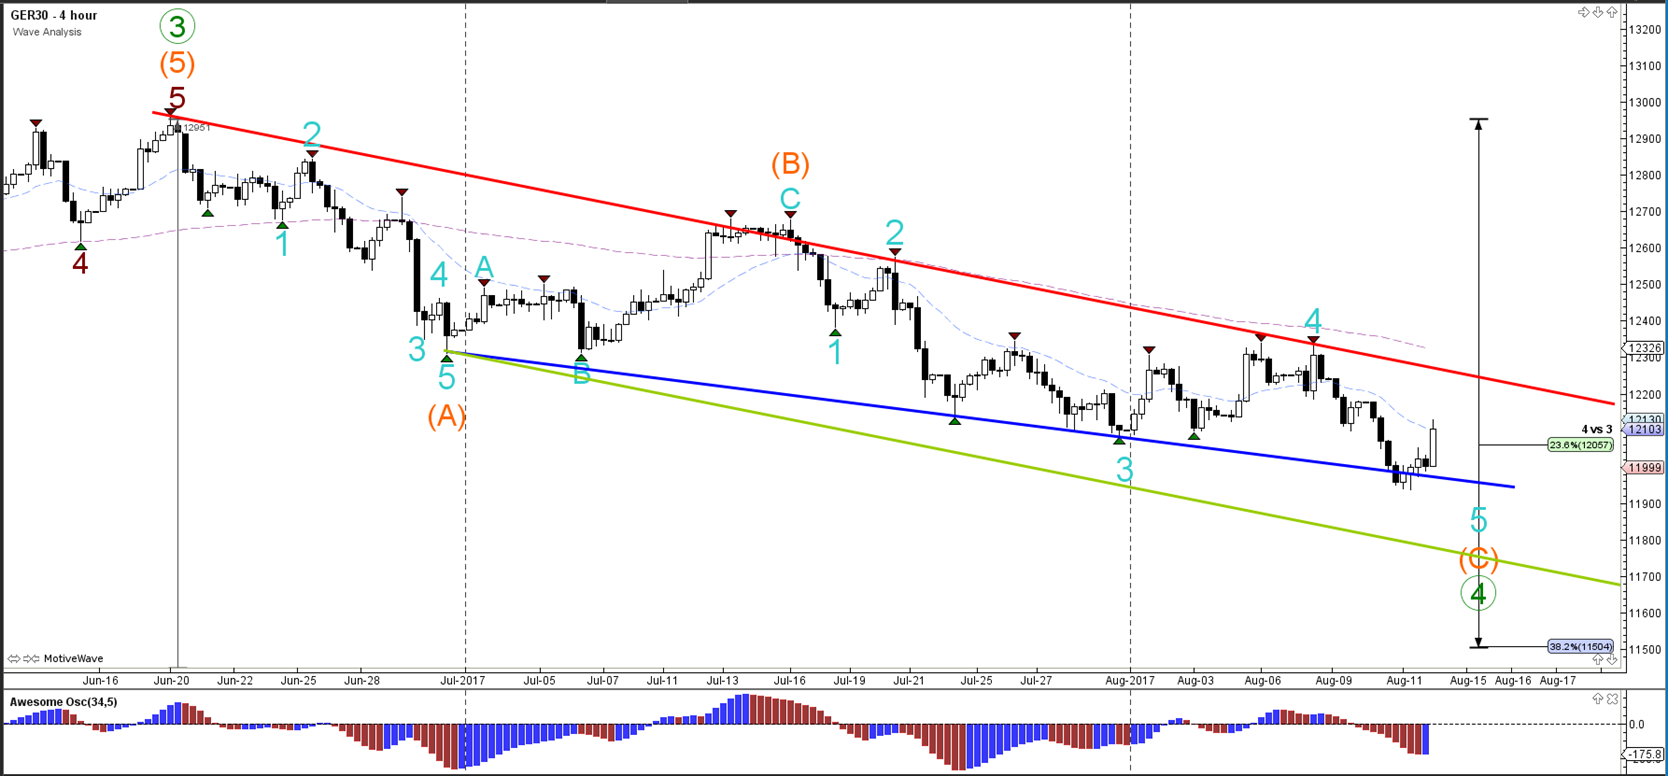
Wave Patterns on Dax30 Index
The German stock index (DAX) is moving lower within a downtrend channel which is indicated by the red and blue trend lines. The bearish channel, however, is most likely part of a larger correction when considering these aspects:
- Impulsive bullish price action could conclude wave 3 (green).
- Price action in bearish channel is corrective and choppy.
- Price is still above the 50% Fibonacci level of wave 4 vs 3.
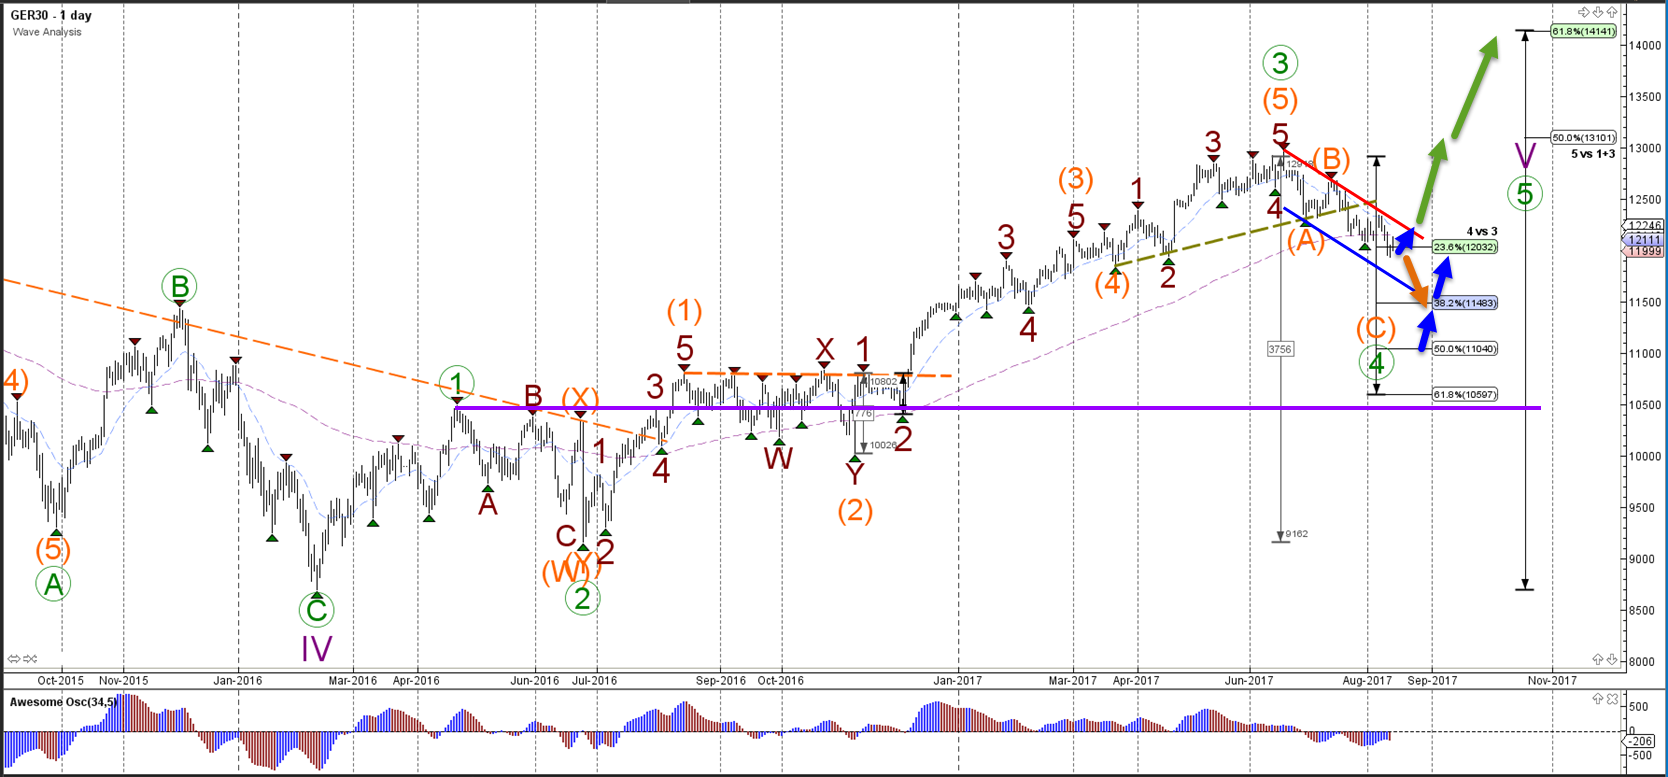
The DAX index is currently testing the 23.6% Fibonacci level of wave 4 (green). A break below it (orange arrow) could see price make one more lower low at the bottom of the channel (blue line) and 38.2% Fibonacci level.
The DAX is expected to show a bullish bounce (blue arrows) at the 23.6%, 38.2%, or 50% Fib if this wave analysis and market structure is correct whereas a break below the top of wave 1 (purple line) would invalidate it.
Another potential trade setup is the bullish breakout (green arrows) above the resistance trend line of the channel (red). A break could see price challenge the Fibonacci target levels of wave 5.
On the 4 hour chart price could be close to completing a 5th wave within the larger ABC zigzag (orange) of wave 4 (green). Price is always able to expand corrections via WXY formations. It is more conservative to wait for:
- a bullish break above the bearish channel or
- a bullish bounce at the 38.2% Fibonacci level of wave 4 at 11504.
Many green pips,
Chris
More info on our ecs.SWAT course and trading system
Twitter: @EliteCurrenSea
YouTube: Elite CurrenSea
AUD/USD video:
DAX video:


how can i identify the A B C Point even before the candle stick get to the place
Hi Dauda, thank you for the great question. You need to analyze the charts with the help of the Elliott Wave Theory. It analyzes the market structure of the chart. We have a course that takes you step by step from knowing zero about waves, all the way to trading the waves without counting the waves. For more info about our SWAT method, please check this page: https://elitecurrensea.com/wave-analysis-trading-swat/. Best, Chris