AUD/USD Bearish Break ? Below Contracting Triangle Pattern ?
Subscribe

Dear Traders,
the AUD/USD seems ready to complete the contracing triangle chart pattern any moment.
The AUD/USD bearish breakout could signal a continuation of the old downtrend before price built a large corrective zone.
Time for a closer look at the wave patterns of the AUD/USD and what targets to expect during a bearish break.
AUD/USD Completing Wave 4
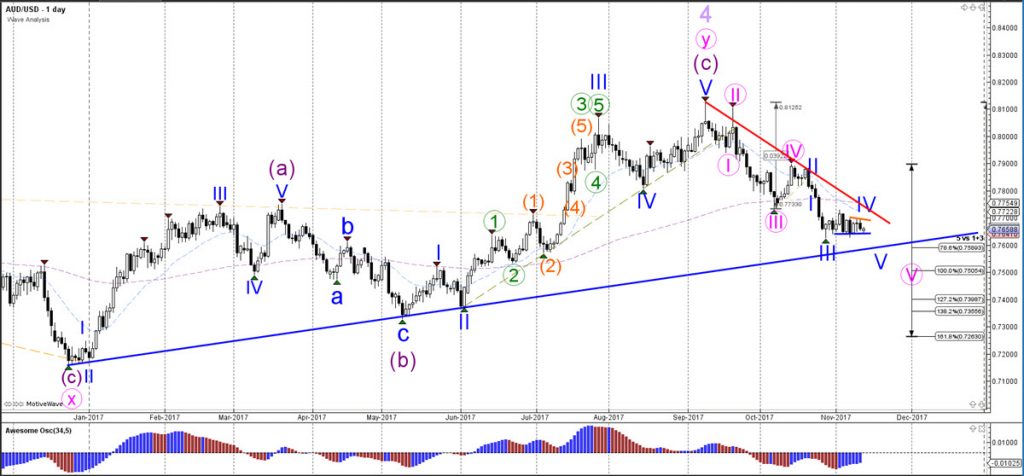
During the past few weeks the AUD/USD has built a massive sideways correction indicating indecision. However, traders should consider and emphasize the bearish momentum when analysing the market structure on the left of this chart. Traders can clearly see that price was showing strong impulsive price action and multiple wave 3’s (pink and blue). Also, keep in mind that there is no divergence present between the most recent bottoms.
These factors indicate two key conclusions:
- The current correction is most likely a wave 4 (blue)
- A bearish break below support (blue) should start a wave 5 of wave 3 (purple)
When is the wave (blue) correction expected to end?
It could be soon as price is building the final 5th leg of the triangle: the wave E (green). A break below the bottom of wave D (green) indicates the bearish breakout.
The invalidation of the wave 3 (green) would occur if price breaks above the top of wave C (green) which is the 100% Fib level of wave E vs D.

AUD/USD Bearish Wave 5 Target
Now let’s talk about targets. How far could the bearish breakout on the 4 hour chart travel?
The wave 5 (blue) is probably only part of a wave 3 (purple) which in turn is part of a larger wave 5 (pink).
The bearish breakout therefore has a decent chance of breaking the bottom at least twice, not considering any potential extentions of the downtend:
- Wave 5 (blue) of wave 3 (purple)
- Wave 5 (purple) of wave 5 (pink).
The conservative target is the blue trend line from the daily chart around 0.75. But a break below that trend line could see price fall towards 0.7250, 0.70, 0.68 and even 0.65.
In fact a bullish bounce at the support trend line (blue) could indicate that wave 5 (pink) has only completed a larger wave 1 (not visible in chart). A bullish bounce could part of wave 2 and the next bearish breakout could be a wave 3 which takes price towards lower targets at 0.68 and 0.65.
Wish you good trading,
Chris Svorcik

.


Leave a Reply