? EUR/USD Bullish Reversal after Break Above Falling Wedge? ?
Subscribe
Hi traders,
the EUR/USD is testing the deep 88.6% Fibonacci retracement level of wave 2 (green). Price seems to be bouncing at this support zone and a bullish breakout above the local resistance trend line (red) could indicate a potential bullish reversal as indicated by the green arrows.
EUR/USD
4 hour
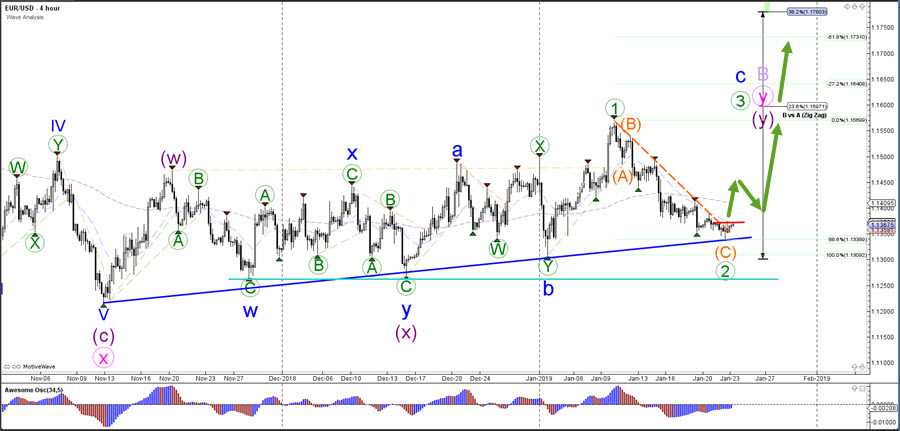
The EUR/USD bullish breakout would finally confirm the wave 1-2 (green) that has been expected over the last 2 weeks. A bullish rally would it more likely that price is finally making an impulsive wave 3 (green). A break below the 100% Fibonacci still invalidates the wave 1-2 pattern whereas price only becomes bearish if it is able to break below the support of the sideways zone (light blue line).
1 hour
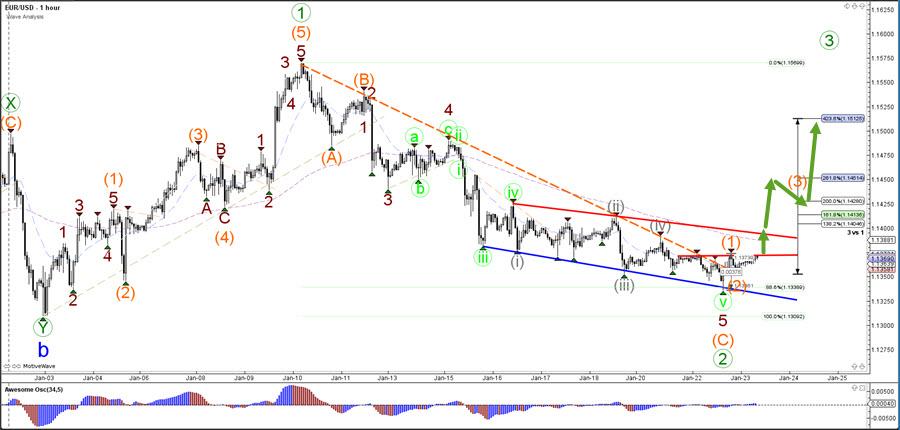 The EUR/USD could slowly be turning and the first sign of the reversal is the potential wave 1-2 (orange) pattern. Price will however need to break above the resistance trend lines (red) before a wave 3 (orange) and a larger bullish reversal becomes more likely. For the moment however, price has managed to break above the falling wedge reversal chart pattern.
For more daily wave analysis and updates, sign-up up to our ecs.LIVE channel.
Good trading, Chris Svorcik


Leave a Reply