? EUR/USD Double Bottom Reversal Chart Pattern at 1.11 ?
May 27, 2019
3 min read
Subscribe
Hi traders,
the EUR/USD made a bullish bounce at the previous bottom (blue line), which is indicating a double bottom reversal chart pattern. A continuation of the sideways range pattern seems now more likely.
EUR/USD
4 hour
The EUR/USD seems to be expanding the wave 4 (green) corrective pattern after bouncing at the support line (blue). The bounce indicates the end of a bearish wave X (orange) and the potential start of bullish wave Y (orange). A bullish ABC is likely to take place before price can complete the larger wave 4 (green) pattern. Fibonacci
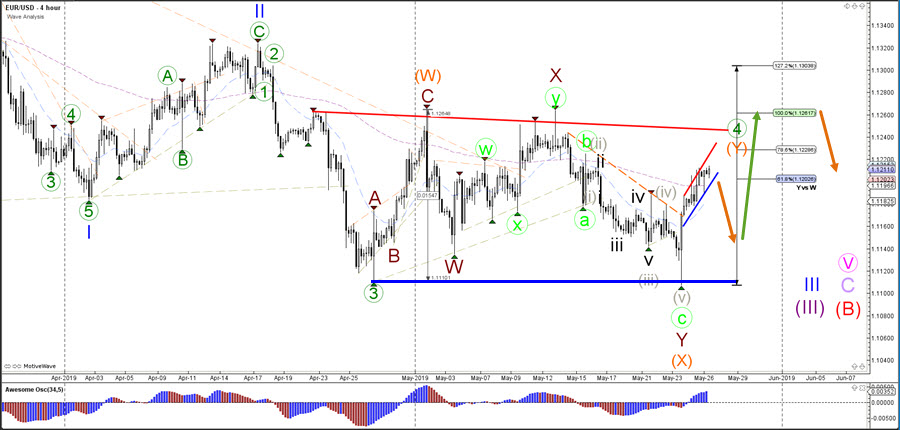
1 hour
The EUR/USD is building a bullish channel which could be a wave A (dark red) of a potential larger ABC zigzag pattern. A break below the support trend line (blue) indicates the start of a retracement towards the Fibonacci levels of wave B vs A, which could be bouncing spots for a potential larger push up again.
For more daily wave analysis and updates, sign-up up to our ecs.LIVE channel.
Good trading, Chris Svorcik


Leave a Reply