✅ EUR/USD Prepares for Bullish Wave C at 1.14 Support ✅
Subscribe
Hi traders,
The EUR/USD broke above the resistance trend lines (dotted red) after completing a wave B (blue) of a larger bullish ABC (blue) zigzag pattern. The EUR/USD looks ready for a bullish continuation.
EUR/USD
4 hour

The EUR/USD seems to be building a wave 1-2 (green) pattern within wave C (blue). Price could confirm this expected wave pattern when price bounces at the support trend line (blue) or breaks above the next resistance trend line (red). A bullish breakout could see price move up towards the Fibonacci targets whereas a break below the bottom of wave B (blue) invalidates the wave 2.
1 hour
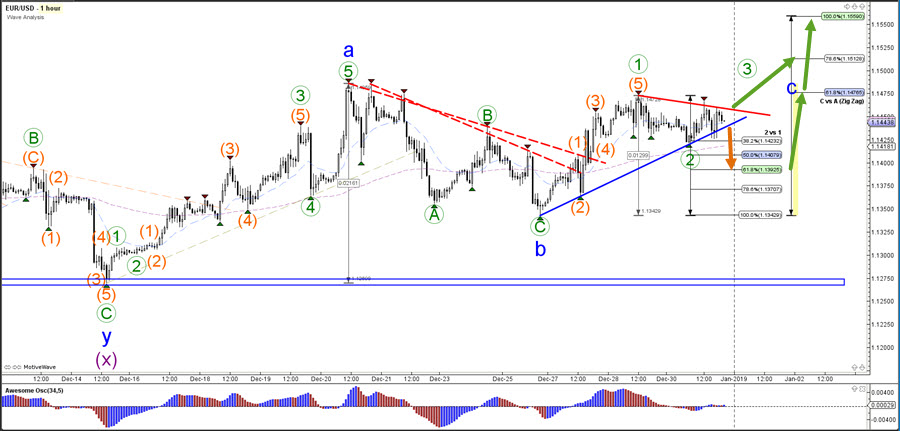
The EUR/USD seems to have completed 5 waves (orange) in wave 1 (green) and could be building an ABC correction in wave 2 (green). The Fibonacci levels of wave 2 vs 1 could act as support and bouncing spots.
For more daily wave analysis and updates, sign-up up to our ecs.LIVE channel.
Good trading,
Chris Svorcik
Elite CurrenSea


Leave a Reply