? EUR/USD Reaches 50% Fib Zone after Strong Bull Impulse ?
Subscribe
Hi traders,
The EUR/USD is testing the resistance trend line (red) which is a major decision zone for a bullish break or bearish bounce. A bullish breakout could see price test the Fibonacci levels of wave C vs A (blue).
EUR/USD
4 hour
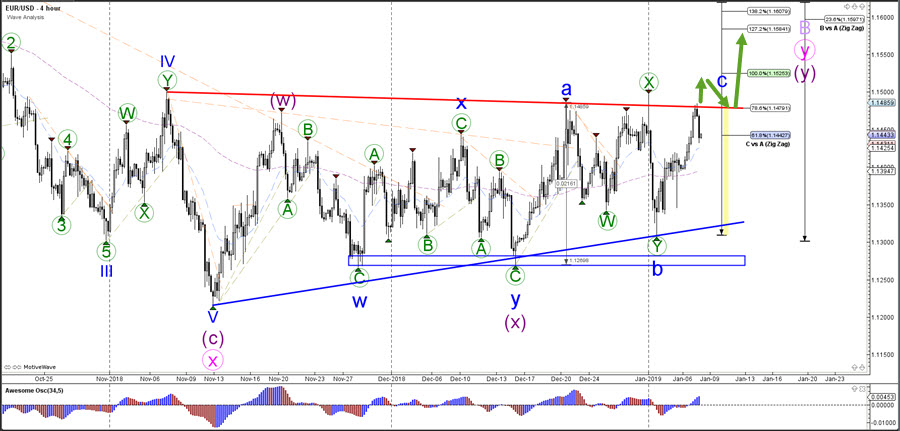
The EUR/USD has been choppy and corrective in the last months. Whether price is able to break above the consolidation zone remains to be seen but it would confirm the current wave pattern.
1 hour
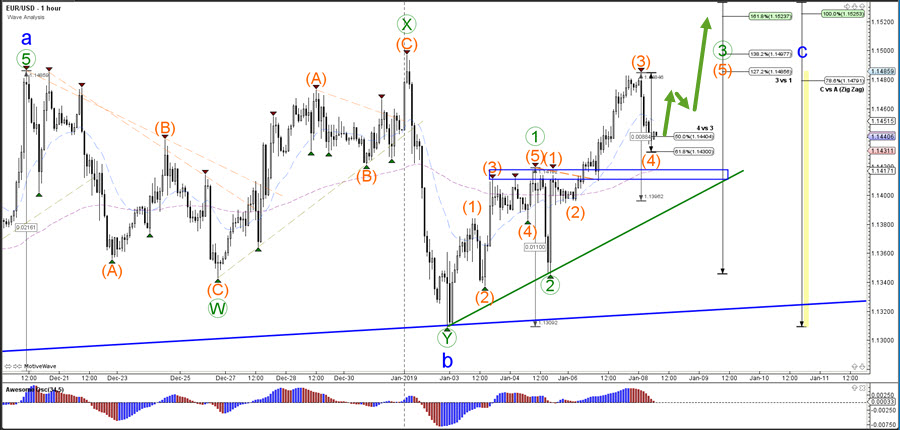
The EUR/USD is making a bearish pullback which is testing the Fibonacci levels of wave 4 vs 3 (orange). The Fib levels could be act as a support zone and cause price to bounce back up, which could be part of a larger wave 3 (green). A break below the support zone (blue) however invalidates the current expected 5 bullish waves (orange).
For more daily wave analysis and updates, sign-up up to our ecs.LIVE channel.
Good trading,
Chris Svorcik
Elite CurrenSea


Leave a Reply