EUR/USD – Remaining Bearish Despite Further Pullback
Subscribe
Dear Traders,
The EUR/USD continues to behave in a skittish manner. Will we now see a more significant recovery or a downtrend continuation? Today’s analysis will provide an updated short-term wave analysis.
Expanding Flat Remains a Real Possibility
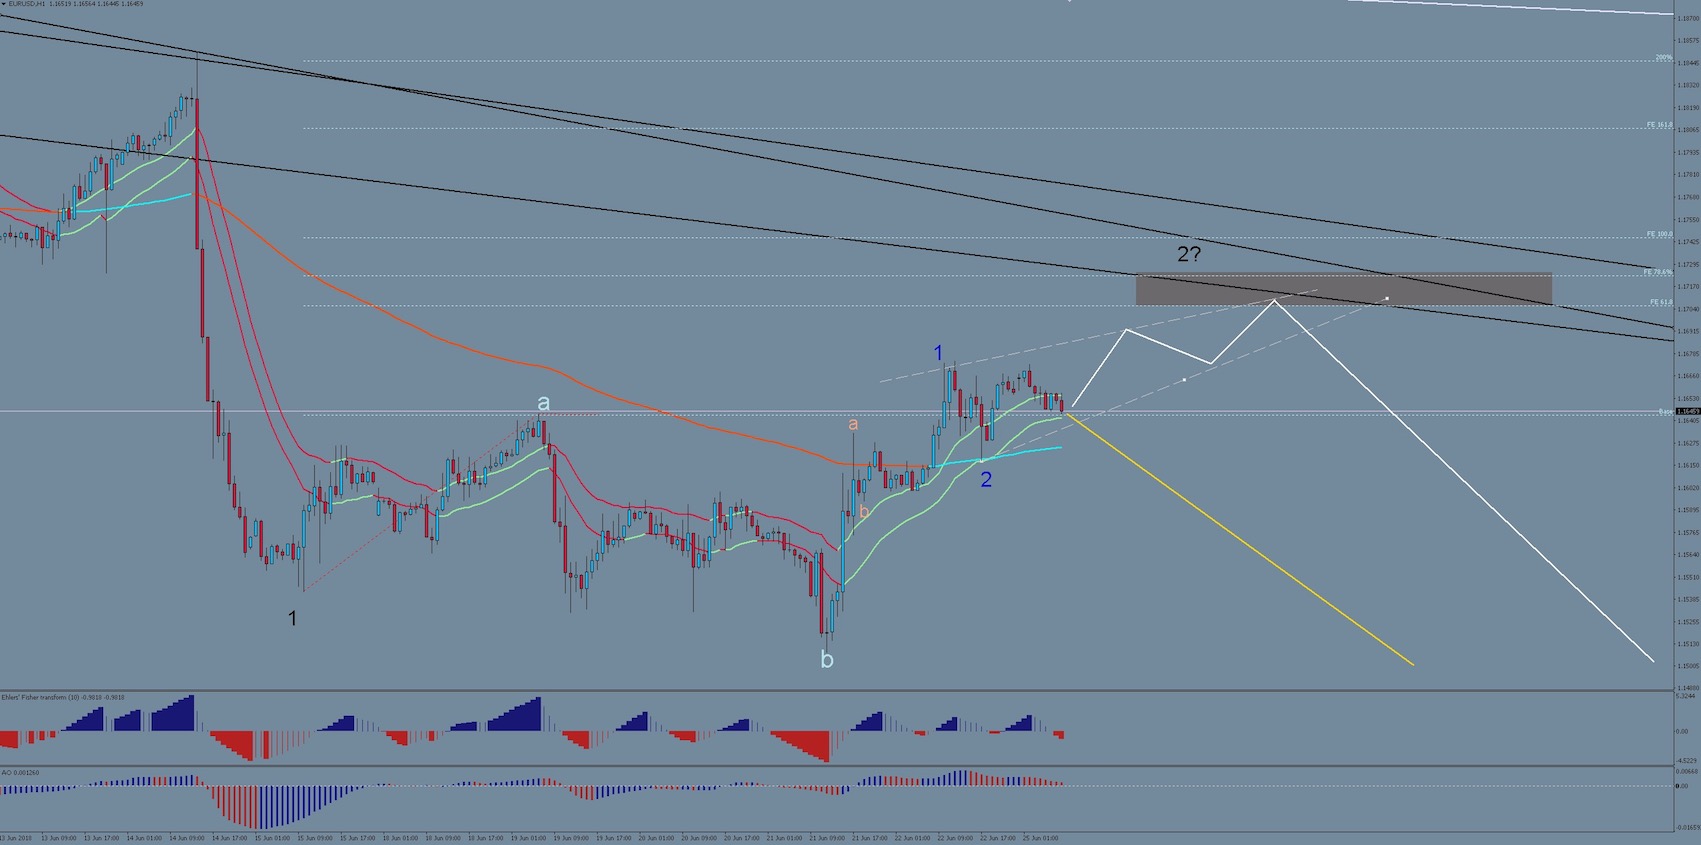
The EUR/USD created a fairly strong bullish bounce during the later part of last week. At first glance, it is tempting to interpret this as a potential completion of the overall downtrend, but things are not as clear cut upon closer inspection.
Labeling the low of June 15 as the end of wave 3 of 5, and the ranging price action afterwards (into the June 21 low) as wave 4 of 5 and 5 of 5, is potentially dangerous because wave 4 would be utterly disproportionate in relation to 1, 2 and 3 within the sequence, thereby going against the guidelines of wave equality and balanced proportions.
In addition, the downwards move most likely finished via a 3-wave sequence (pale blue ‘b’ in chart above), which would suggest that bearish price-action is not complete to the downside.
The alternative wave count that could potentially resolve these anomalies would be to label the price-action since the June 15 low as an expanding flat within a wave 2. The structure looks very valid so far in this regard and the extent of wave 2 vs wave 1 (black labels) in terms of size and duration is more sound. The upwards move since the June 21 low is beginning to show signs of overlapping and also 3-wave swings as its internal structure. This could mean that a diagonal is in the process of forming within wave c of 2 (pale blue and black labels). The white lines show the projected price path for this scenario.
There is a confluence of relevant Fibonacci retracement and extension targets between 1.17 – 1.725 as well as multiple resistance trend lines (black), which could be an ending point if a diagonal is indeed forming right now. A strong bearish bounce at that level would be a significant sign for more bearish continuation.
A less likely (but also possible) scenario could be an immediate build-up of bearish momentum that would lead to a break of the June 21 low more quickly (yellow price line).
On the other hand, a bullish break above 1.1725 and the black trend lines would pretty much invalidate this scenario and things will have to be reviewed if this comes to pass.
All the best along your trading journey.
Hubert
.


Leave a Reply