? EUR/USD Triangle Pattern or Bear Break in Downtrend ?
May 21, 2019
2 min read
Subscribe
Hi traders,
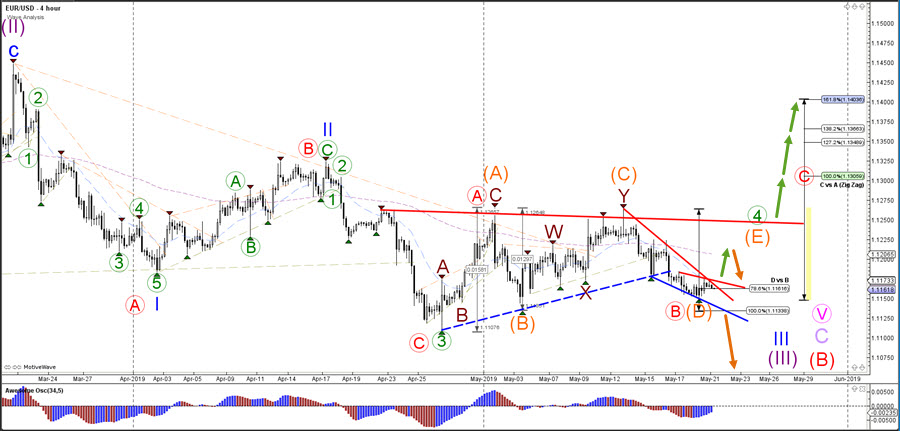
the EUR/USD is either in a wave D-E of a larger triangle chart pattern or ready for an immediate bearish breakout within the larger downtrend.
EUR/USD
4 hour
The EUR/USD is testing the Fibonacci retracement levels of wave D vs B again. A break below the 100% Fib level confirms a bearish breakout and downtrend whereas a bullish breakout above the resistance (red) trend line could indicate the start of the wave E (orange).
1 hour
The EUR/USD pullback could be a wave B (dark red) of a larger bullish ABC (dark red) zigzag pattern in wave E (orange) of wave 4 (green) if price bounces at the Fibs of wave B vs A. A bearish breakout, however, indicates that the triangle pattern has most likely been completed.
For more daily wave analysis and updates, sign-up up to our ecs.LIVE channel.
Good trading, Chris Svorcik


Leave a Reply