? GBP/USD Again Testing Key Support of Triangle Pattern ?
Subscribe
Hi traders,
GBP/USD is going sideways and is unable to move away from the support trend line (blue). A bullish breakout above the resistance trend line however would confirm a bullish bounce and continuation within the triangle chart pattern.
GBP/USD
4 hour
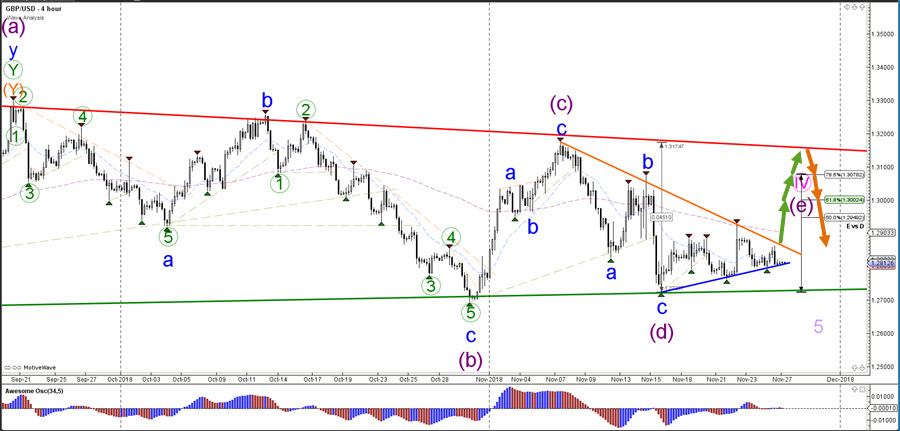
The GBP/USD wave and chart pattern are showing a potential triangle formation within a wave 4 (pink). Price needs to break below the support trend line (green) for a bearish breakout but a bullish break seems most likely at the moment.
1 hour
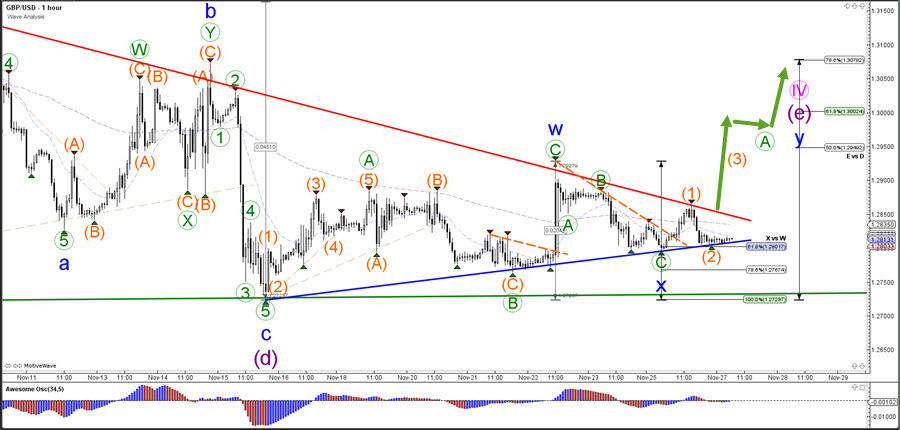
The GBP/USD seems to have completed a wave 1 and wave 2 (orange) as long as price stays above the support trend line (blue). The bullish breakout could confirm a wave 3 (orange) pattern within a larger bullish ABC pattern (green) or an immediate wave C. The Fibonacci levels indicate key support and resistance levels.
For more daily wave analysis and updates, sign-up up to our ecs.LIVE channel.
Good trading,
Chris Svorcik
Elite CurrenSea


Leave a Reply