? GBP/USD Bearish Wave C Tests Triangle Chart Pattern ?
November 21, 2018
2 min read
Subscribe
Hi traders,
The GBP/USD is moving sideways after bouncing at the support trend line (green). The bullish bounce makes the continuation within a contracting triangle chart pattern more likely.
GBP/USD
4 hour
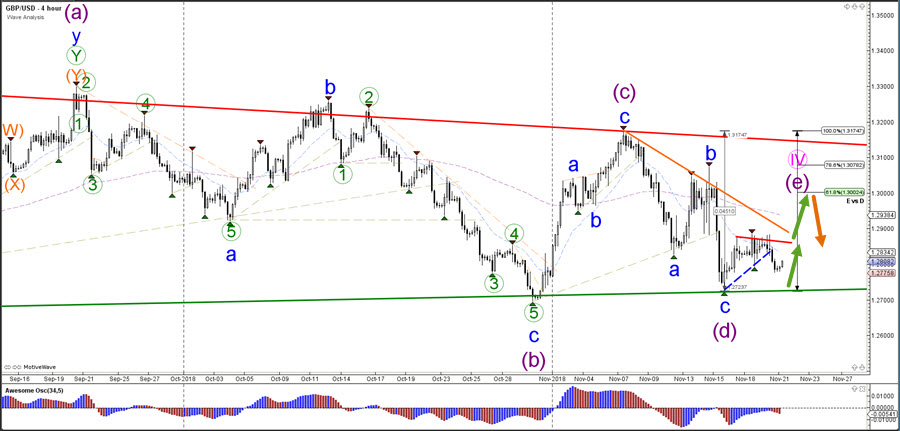
The GBP/USD is expected to make a bullish bounce back towards the top of the triangle pattern unless price breaks below the support line (green). The Fibonacci levels of wave E vs D could act as potential resistance levels.
1 hour
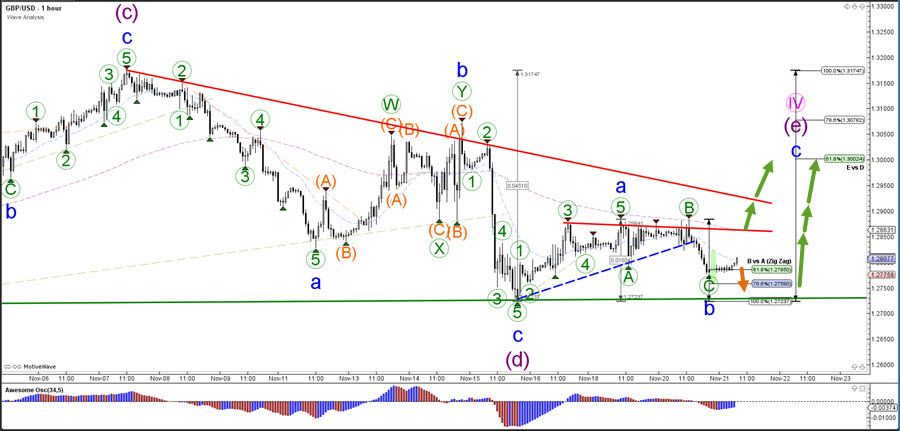
The GBP/USD has completed or is close to completing a wave C (green) within wave B (blue). A bullish bounce is expected if price indeed completes the bullish ABC (blue) zigzag correction.
For more daily wave analysis and updates, sign-up up to our ecs.LIVE channel.
Good trading,
Chris Svorcik
Elite CurrenSea


Leave a Reply