? GBP/USD Bullish Pullback Aims for 1.27 Within Downtrend ?
Subscribe
Hi traders,
the GBP/USD is breaking the resistance trend line (dotted red) of the downtrend channel. The bullish breakout could indicate an expansion of the wave 4 (green) correction.
Join the 2 week free trial of our signal and analysis service called ecs.LIVE – it starts Monday 3 June!
GBP/USD
4 hour
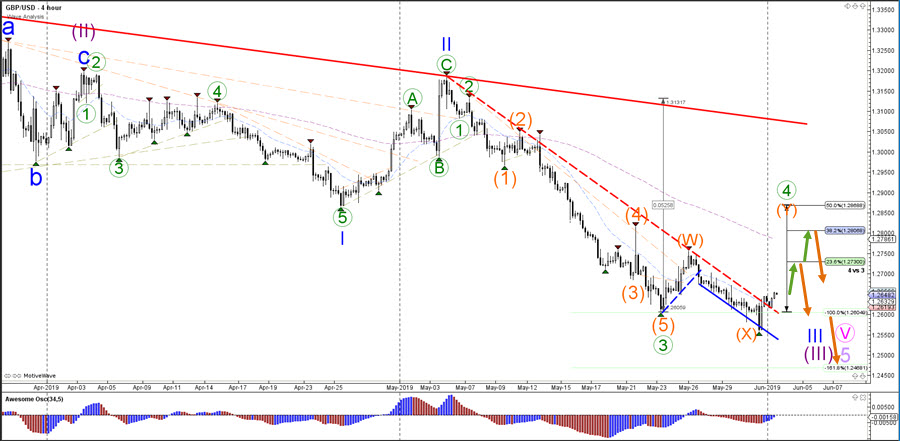
The GBP/USD seems to be building a WXY (orange) correction within wave 4 (green). Price is expected to retest the 23.6% or 38.2% Fibonacci retracement levels of wave 4 vs 3, which should be bearish bouncing spots for a bearish trend continuation. An immediate breakout below 1.2575 could indicate a failure of price to move higher and start a move lower towards 1.25.
1 hour
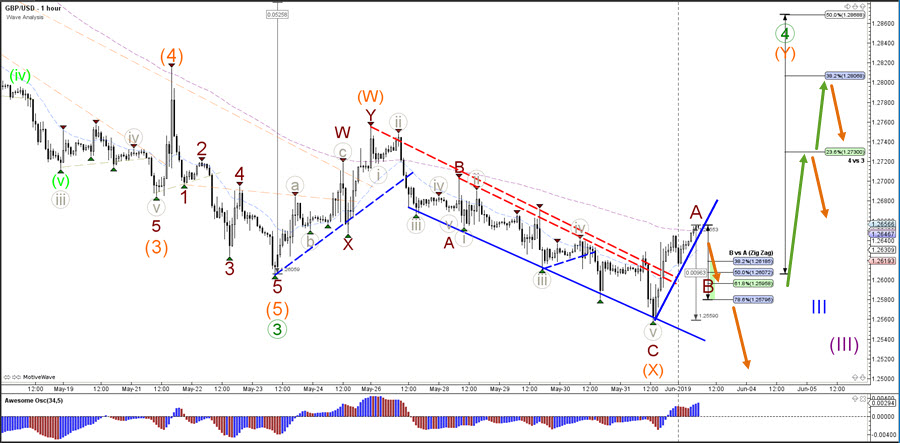
The GBP/USD seems to have completed a bearish ABC zigzag (dark red) pattern within wave X (orange) and could be ready for a similar bullish ABC (dark red) wave pattern. If the expected wave pattern is correct then the Fibonacci levels of wave B vs A should be used a support and price may not break below the previous bottom.
For more daily wave analysis and updates, sign-up up to our ecs.LIVE channel.
Good trading,
Chris Svorcik
Elite CurrenSea


Leave a Reply