? GBP/USD Bullish Retrace or Reversal Depends on 1.26 Resistance ?
Subscribe
Hi traders,
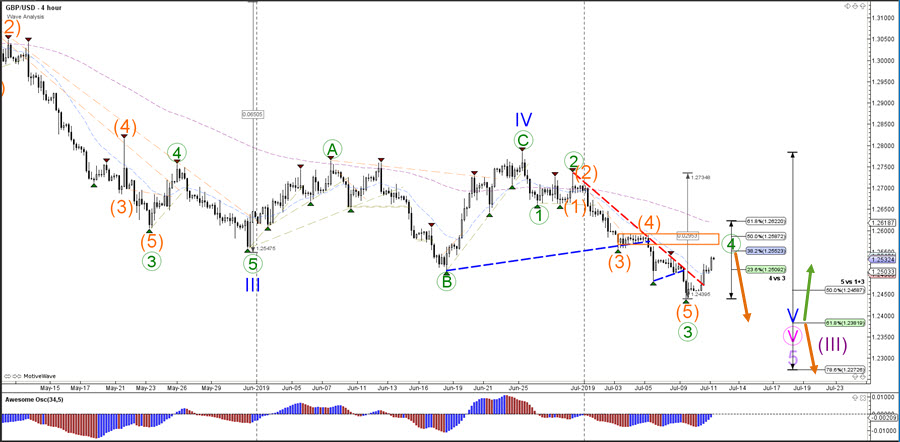
the GBP/USD broke above the resistance trend line (dotted red) of the downtrend channel. This bullish breakout could be a larger pullback within the downtrend or indicate a bullish reversal. Today’s article discusses the key levels that are likely to determine the next direction.
GBP/USD
4 hour
For the moment, the wave patterns are assuming that the current bullish pullback is a wave 4 (green) retracement. If that is true, then price is expected to bounce at the 38.2% and 50% Fibonacci retracement levels of wave 4 vs 3 and move lower for at least one more lower low. However, a bullish breakout above that 50% Fib or strong bullish momentum could indicate that the bullish price action is not a pullback but a reversal.
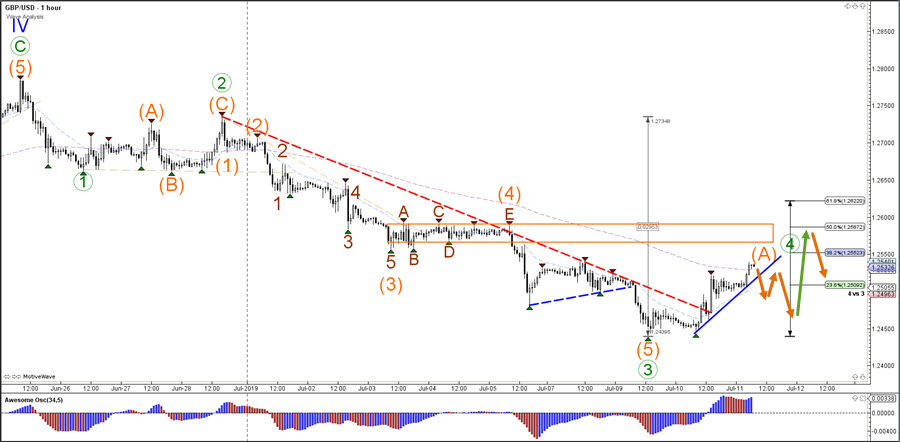
1 hour
The GBP/USD is showing bullish momentum, which seems to be a wave A (orange) of a larger wave 4 (green) for the moment. This remains valid as long as price stays below the 50% Fibonacci level. A break below the support trend line (blue) could be a wave B (orange), which means that the expected bearish price action could be limited with the GBP/USD.
For more daily wave analysis and updates, sign-up up to our ecs.LIVE channel.
Good trading,
Chris Svorcik
Elite CurrenSea


Leave a Reply