✅ GBP/USD Bullish Reversal at 1.2750 Indicates More Upside ✅
Subscribe
Hi traders,
GBP/USD made, as expected, a bullish bounce at the bottom of the triangle (green line) and is now moving higher as part of a larger bullish correction. Price action is also showing strong momentum after breaking above the resistance (dotted orange) trend line.
GBP/USD
4 hour
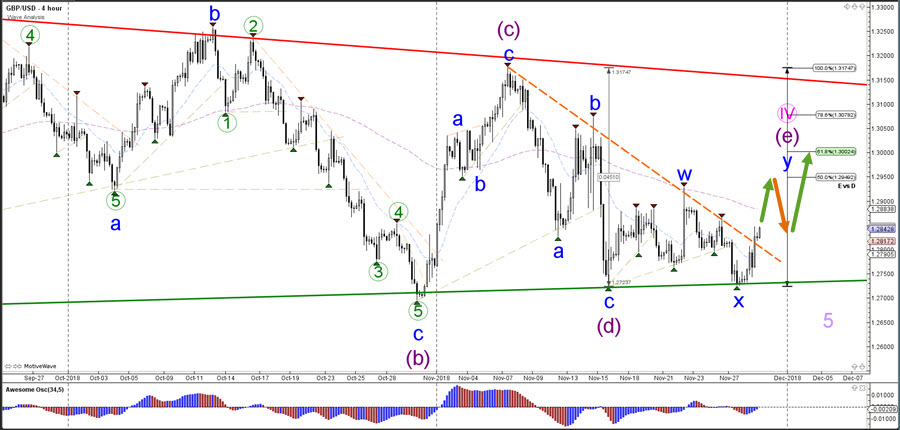
The GBP/USD is aiming for the Fibonacci levels of wave E vs D (purple). Price seems to be completing a complex WXY (blue) correction within wave E (purple), although price could also still be in wave C of the triangle if the triangle pattern continues sideways.
1 hour
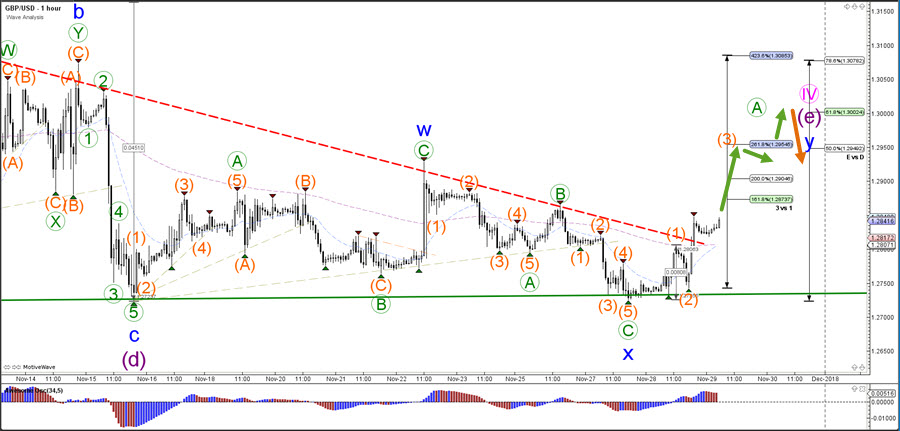
The GBP/USD seems to building a wave 123 (orange) pattern within a larger wave A (blue) of an expected ABC pattern. A continuation towards the Fibonacci targets of wave 3 vs 1 seems the most likely at the moment.
For more daily wave analysis and updates, sign-up up to our ecs.LIVE channel.
Good trading,
Chris Svorcik
Elite CurrenSea


Leave a Reply