? GBP/USD Challenges 1.27 Resistance Zone but Fails to Break ?
Subscribe
Hi traders,
The GBP/USD is challenging the resistance trend lines but so far has failed to make a break. A bearish bounce however could confirm the wave 4 (green) pattern in the chart.
GBP/USD
4 hour
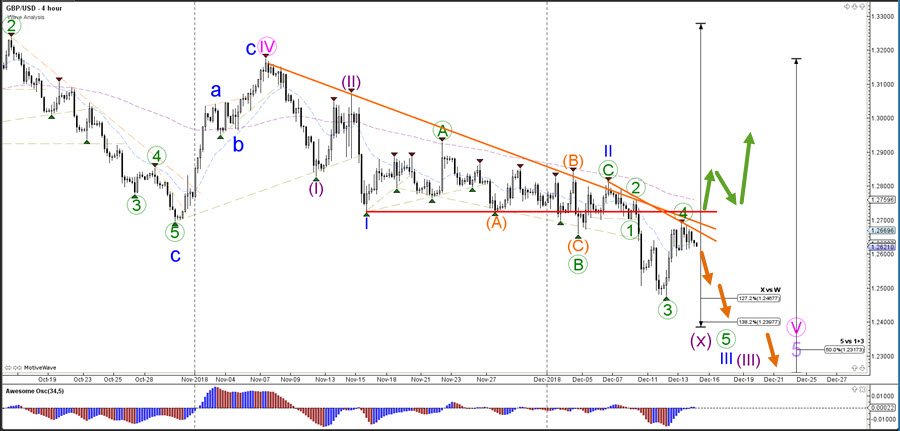
The GBP/USD is at a key decision zone for a bullish break or bearish bounce. Price is either building an expanded WXY (purple) correction or a full downtrend. The key level is the 138.2% Fibonacci level. A bearish break indicates a downtrend whereas a bullish break above the resistance trend lines indicates a larger correction.
1 hour
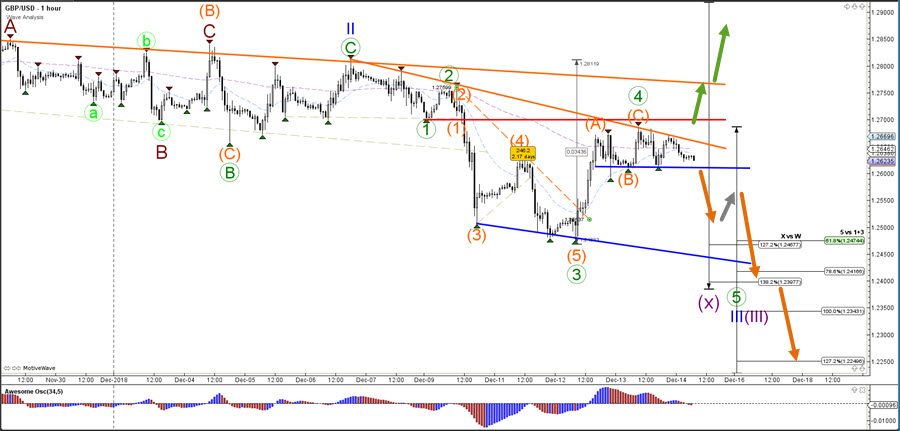
The GBP/USD could have completed a bullish ABC (orange) within wave 4 (green) but the price action is volatile due the Brexit news. The GBP/USD needs to break the neck line (blue) before a bearish breakout is possible.
For more daily wave analysis and updates, sign-up up to our ecs.LIVE channel.
Good trading,
Chris Svorcik
Elite CurrenSea


Leave a Reply