❗️ GBP/USD Challenges 1.27 Support of Triangle Chart Pattern ❗️
Subscribe
Hi traders,
GBP/USD remains corrective and choppy, which could be explained by an ABCDE (purple) triangle chart pattern. This triangle pattern remains valid as long as price stays above the bottom of wave B at 1.27.
GBP/USD
4 hour
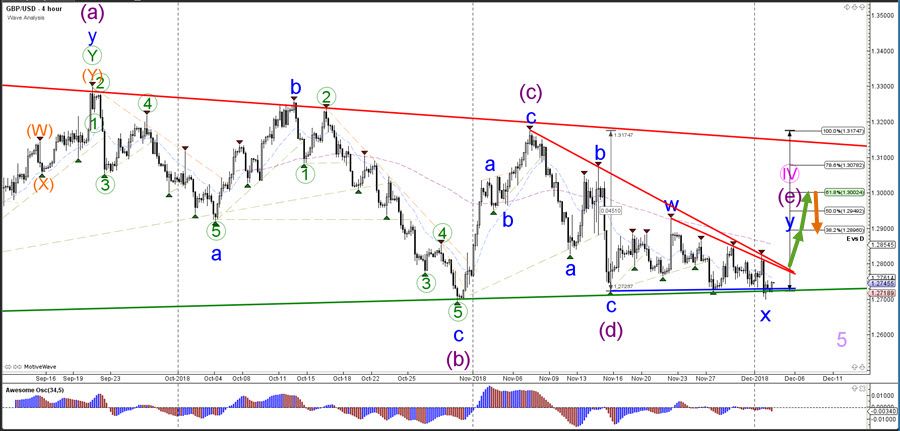
The GBP/USD needs to break above the resistance trend lines (red) to confirm the potential wave Y (blue) correction within the triangle pattern. A bearish break below the support trend lines (green/blue) could indicate a different and bearish wave pattern.
1 hour
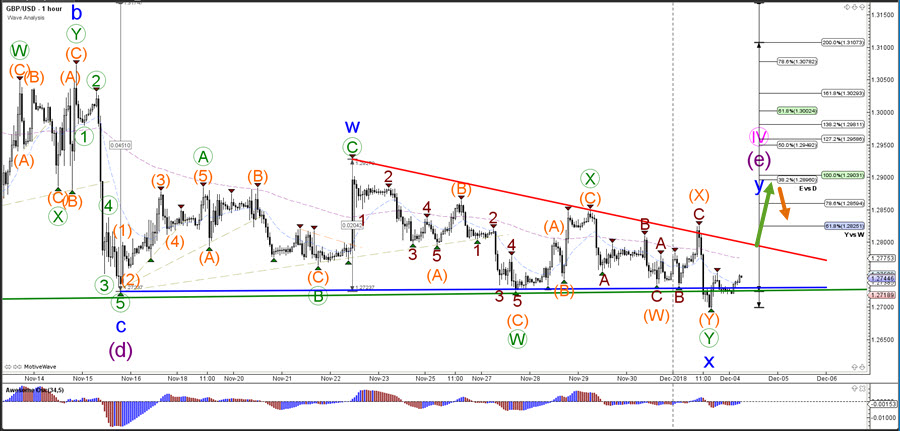
The GBP/USD has been moving up and down between the support and resistance levels of 1.27-1.29 and the sideways price action has created many complex corrections. The chart and wave patterns are indicating that more upside is likely towards the Fibonacci targets.
For more daily wave analysis and updates, sign-up up to our ecs.LIVE channel.
Good trading,
Chris Svorcik
Elite CurrenSea


Leave a Reply