? GBP/USD Long-Term Wave Analysis 9 December ’18 ?
Subscribe
Hi traders,
The GBP/USD is again testing the previous bottom and support trend line (green), which is a decision zone for a bullish bounce or bearish breakout.
GBP/USD
Daily
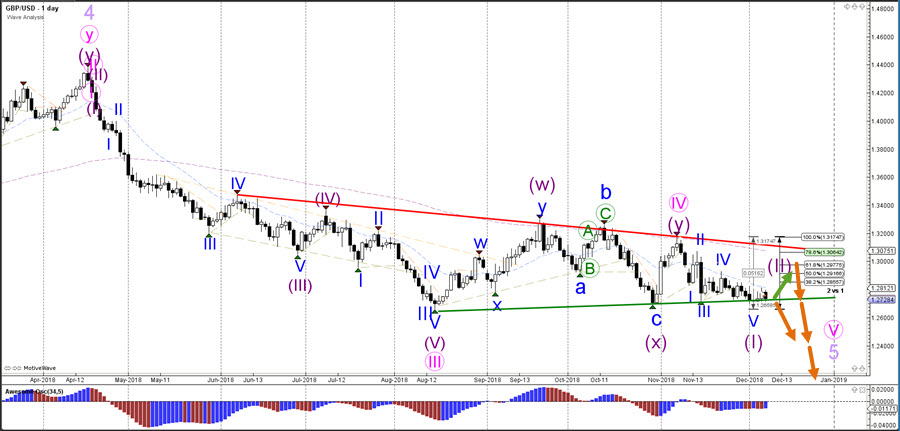
The GBP/USD recent price action remains corrective and seems to be building a falling wedge, which makes a bullish reversal at the support line more probable. The bullish bounce is not expected to break above the resistance trend line (red) and could reverse back down at the Fibonacci retracement levels of wave 2 vs 1. An immediate bearish breakout is possible but only if a strong bearish daily candle closes below the support line.
Weekly

The GBP/USD is building a corrective zone within a larger downtrend. A bearish breakout is expected to eventually take place and that would confirm the wave 4-5 pattern (pink).
Monthly
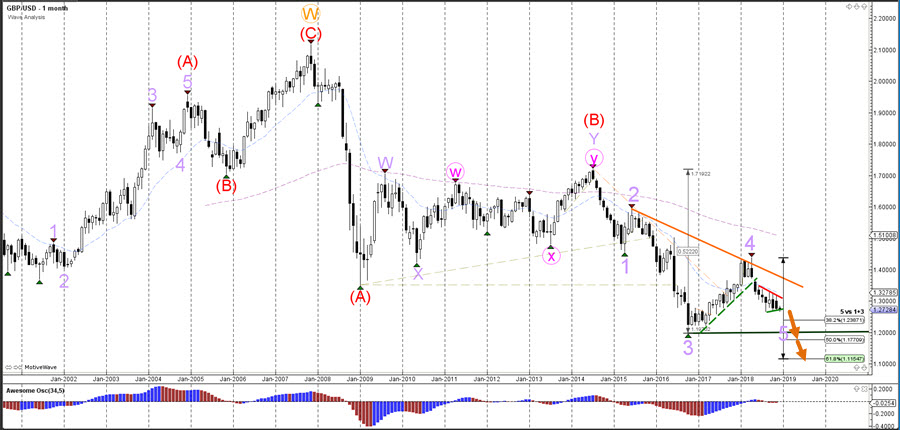
The GBP/USD bearish breakout could confirm a potential bearish wave 5 (purple).
For more daily wave analysis and updates, sign-up up to our ecs.LIVE channel.
Good trading,
Chris Svorcik
Elite CurrenSea


Leave a Reply