? GBP/USD Prepares for Impulsive & Bullish Wave 3 ?
Subscribe
Hi traders,
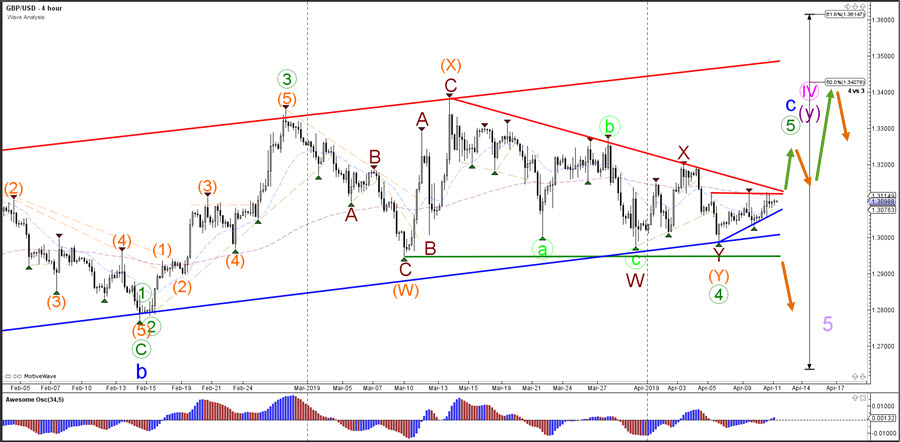
the GBP/USD is testing a key resistance level of the larger corrective triangle chart pattern. The current wave outlook (wave 5 blue) favours a bullish breakout but price action would need to close above the trend lines (red) before a move up towards the 50% Fibonacci retracement level becomes more likely.
Check out for regular updates, webinars, analysis, and setups in the Forex market via ecs.LIVE.
GBP/USD
4 hour
The GBP/USD seems to have completed a potential wave 4 (green) retracement but a confirmation is only possible after a bullish breakout. A bearish bounce, however, could see price move back towards the bottom of the triangle chart pattern.
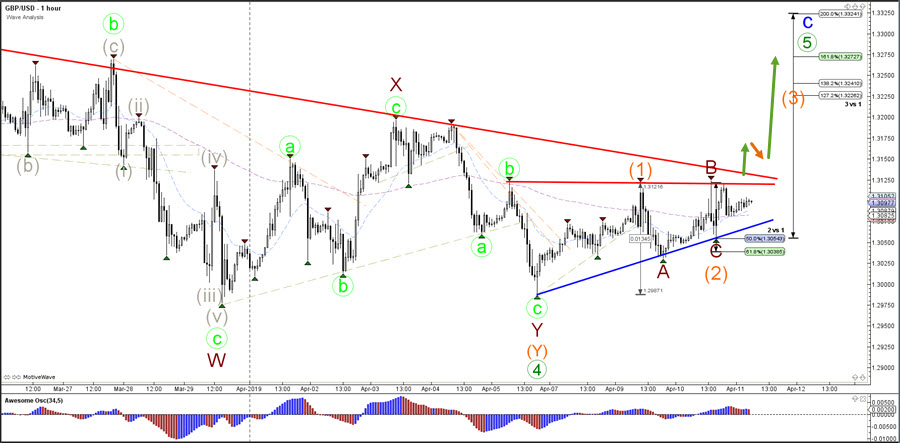
1 hour
The GBP/USD could have completed a bearish ABC (dark red) zigzag pattern within the wave 2 (orange) correction yesterday. If price is starting a wave 3 (orange) impulse, then price is expected to show a bullish breakout soon. A break below the support trend line (blue) could indicate a deeper wave 2 or a chance of wave patterns.
For more daily wave analysis and updates, sign-up up to our ecs.LIVE channel.
Good trading,
Chris Svorcik
Elite CurrenSea


Leave a Reply