☝️ GBP/USD Price Volatility Creates Triangle Chart Pattern ☝️
Subscribe
Hi traders,
GBP/USD made a bullish bounce at the critical support trend line (blue) and is now retesting the resistance zone (red). Price action remains very choppy and corrective and any breakout could become a false break.
GBP/USD
4 hour
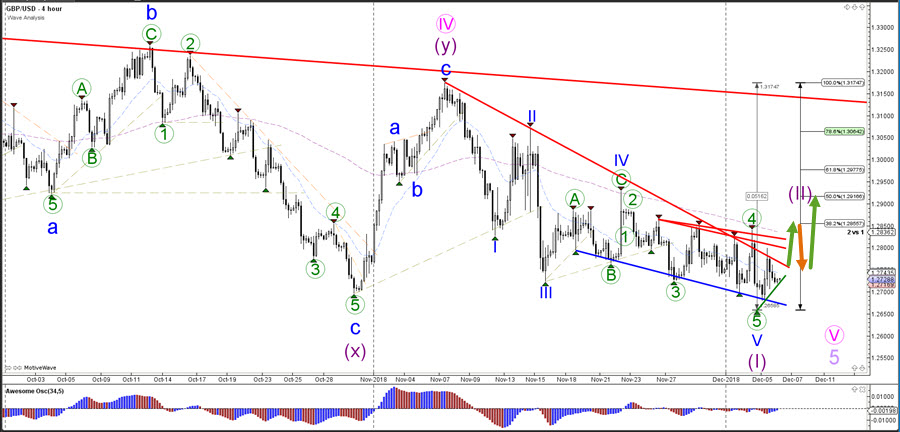
The GBP/USD wave pattern is difficult to determine at this moment due to the large choppy sideways price action. One of the scenarios is that price has competed a leading diagonal for a bearish wave 1 as indicated in the chart but other wave patterns are equally likely. A bullish or bearish break above or below the trend lines would be needed to get more information but each breakout is vulnerable to a false break.
1 hour
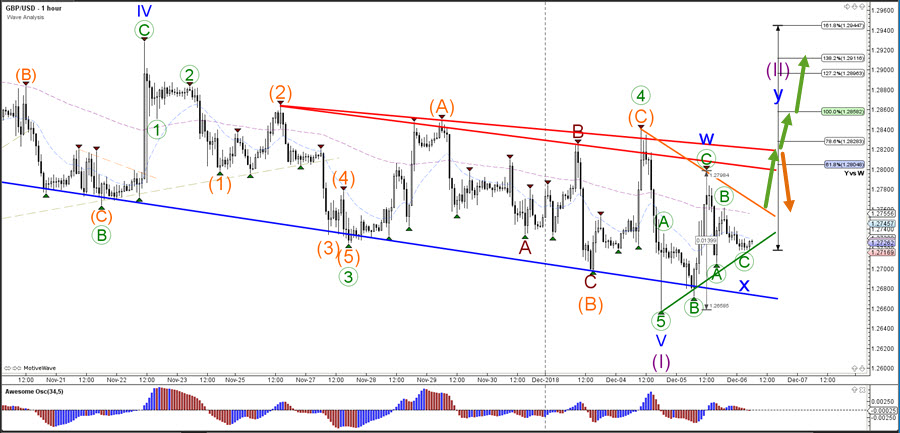
The GBP/USD tested the support zone (blue) but price bounced back up via an ABC correction (green). Price seems to have completed a new ABC (green) which seems to form a potential WXY (purple) correction. A bullish break is aiming for the Fibonacci targets whereas a break below the support could indicate a new downtrend.
For more daily wave analysis and updates, sign-up up to our ecs.LIVE channel.
Good trading,
Chris Svorcik
Elite CurrenSea


Leave a Reply