GBP/JPY Bearish Retracement in Larger Daily Uptrend
Subscribe
Hi Traders,
today’s analysis is focused on the GBP/JPY and its perspective for the rest of the 2017 trading year. The GBP/JPY seems to offer an interesting break, pullback, and continuation pattern on the daily chart.
Nenad also completed his analysis yesterday on the GBP/JPY but on the 1 hour chart rather than a daily time frame. FYI his analysis neatly anticipated the 100+ pip bearish breakout and we hope you managed to squeeze some pips from this move.
Check out this article to see a clear top-down approach of the GJ monthly, weekly and daily time frames.
GBP/JPY Shows Key Bullish Breakout
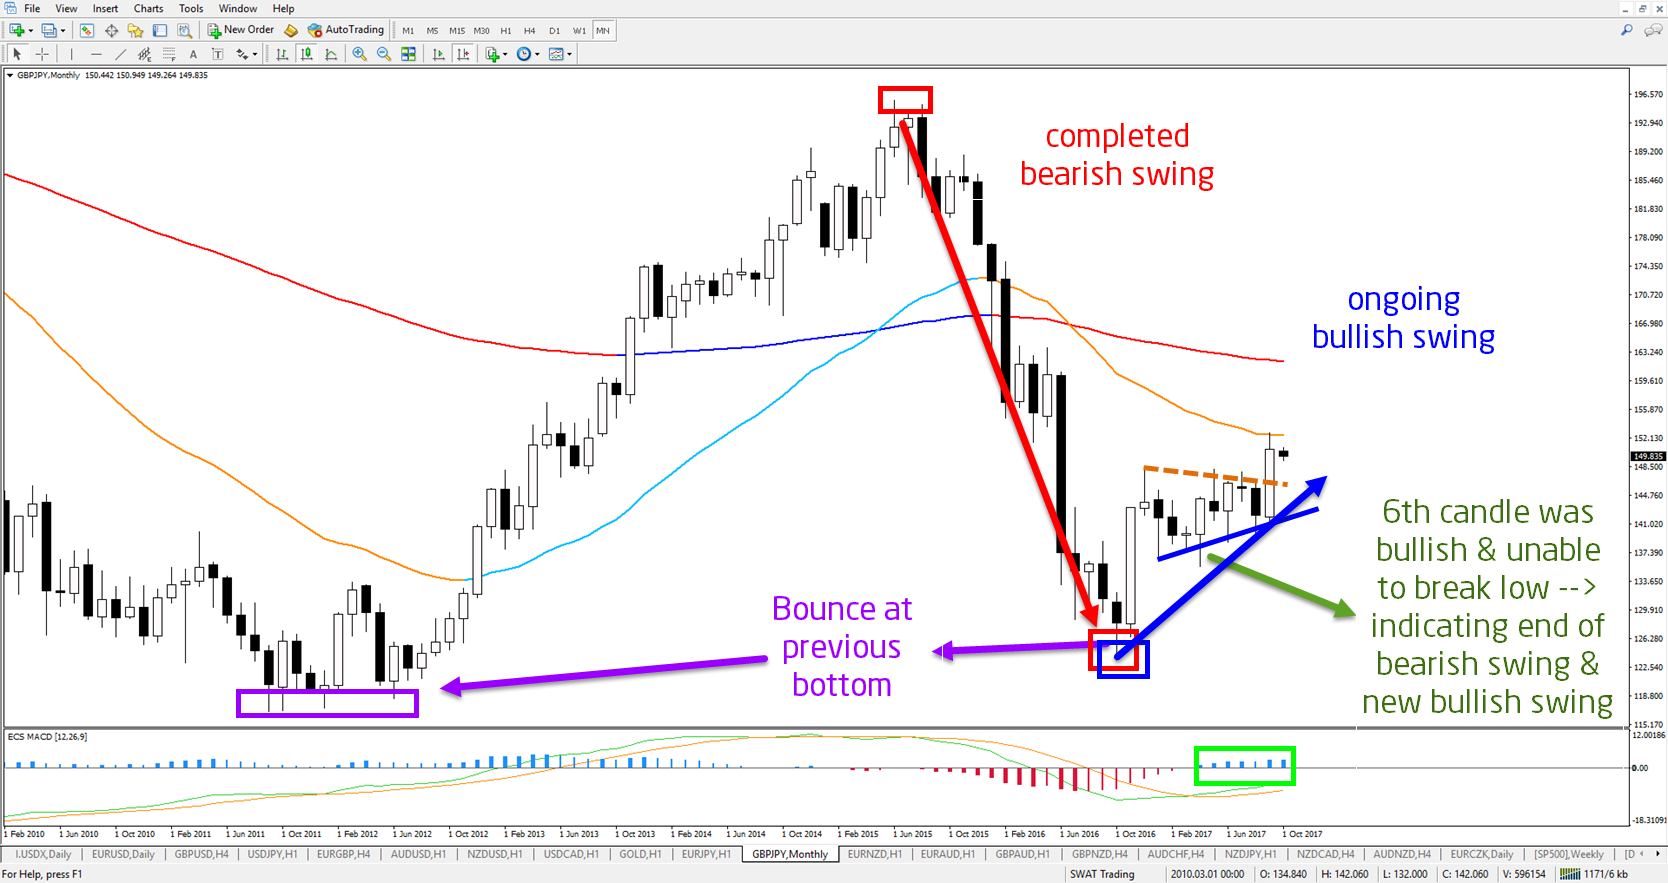
Our first step in our long-term analysis of the GBP/JPY is to analyse the monthly chart and monthly candle (September 2017), which is confirming two important aspects:
- Presence of bullish momentum and continuation.
- Confirmation of a higher high and a good candle close last month.
Point A: in the GJ image of the monthly chart (see below) you will find more useful information about why price is currently in a bullish momentum.
Point B: the monthly candle broke above the resistance (dotted orange) of the triangle pattern and confirmed a higher high. The difference between September’s high and low is 1167 pips which makes it a decent sized candle.
A key feature of the breakout is the good candle close near the high. The candle close is only 218 pips away from the candle high, which means that the top wick is 18.6% (in comparison with the total candle size). This indicates a pretty good breakout candle.
GBP/JPY Bullish Zigzag Breaks Triangle
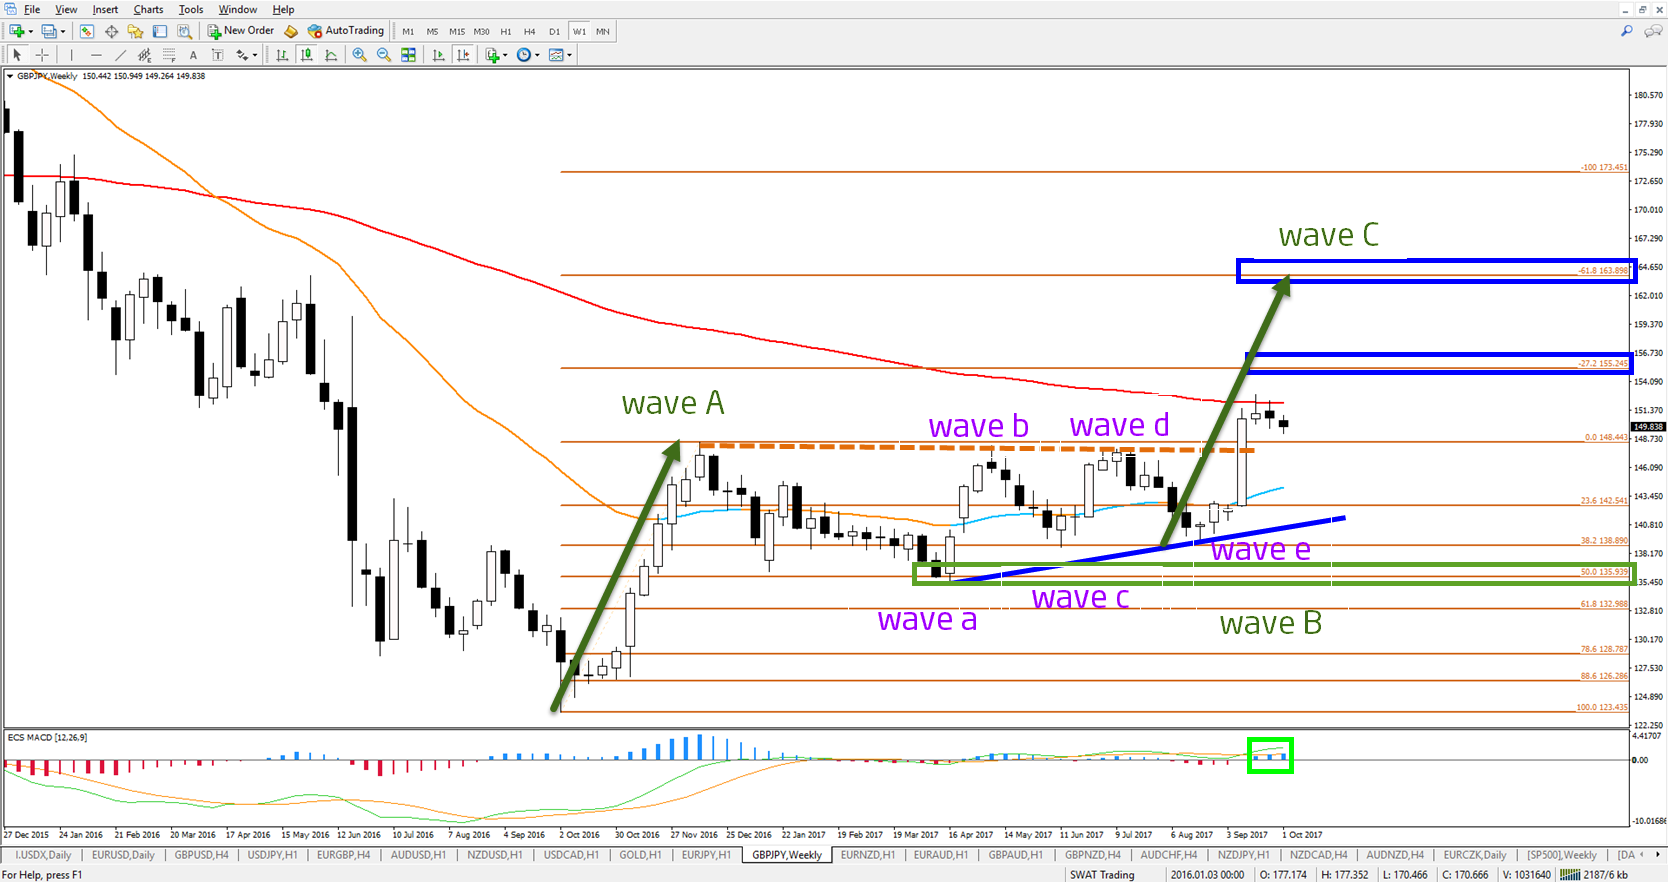
The weekly chart is showing interesting patterns and market structure. Let’s summarise the most important ones:
- The first bullish momentum (green arrow) could be a wave A (green) or alternatively it could be a wave 1.
- The second green arrow is equal to the first arrow because often wave C equals wave A. The main target of the ABC is therefore +/- 163-164. Price could extend further if price is in a wave 3 rather than a wave C.
- Price bounced at the 50% Fibonacci support level (green box), which makes a -61.8% Fibonacci level the most likely target. Price could make a (large) retracement as well at the -27.2% Fib target.
- Price made a bullish break above the resistance (dotted orange) of the triangle chart pattern (wave a-e purple) with a good breakout candle. The two indecision candles after that show a potential for retracement but price is still in a bullish momentum because it did not fail to show a higher high in the past 6 candles.
- Notice the bullish momentum on the ecs.MACD (green box). It’s visible on both the weekly and monthly charts.
All in all, the long-term outlook is bullish. It’s time to review the daily chart and see how far and deep this bearish retracement could go.
Two Methods for Trading End of Retracement
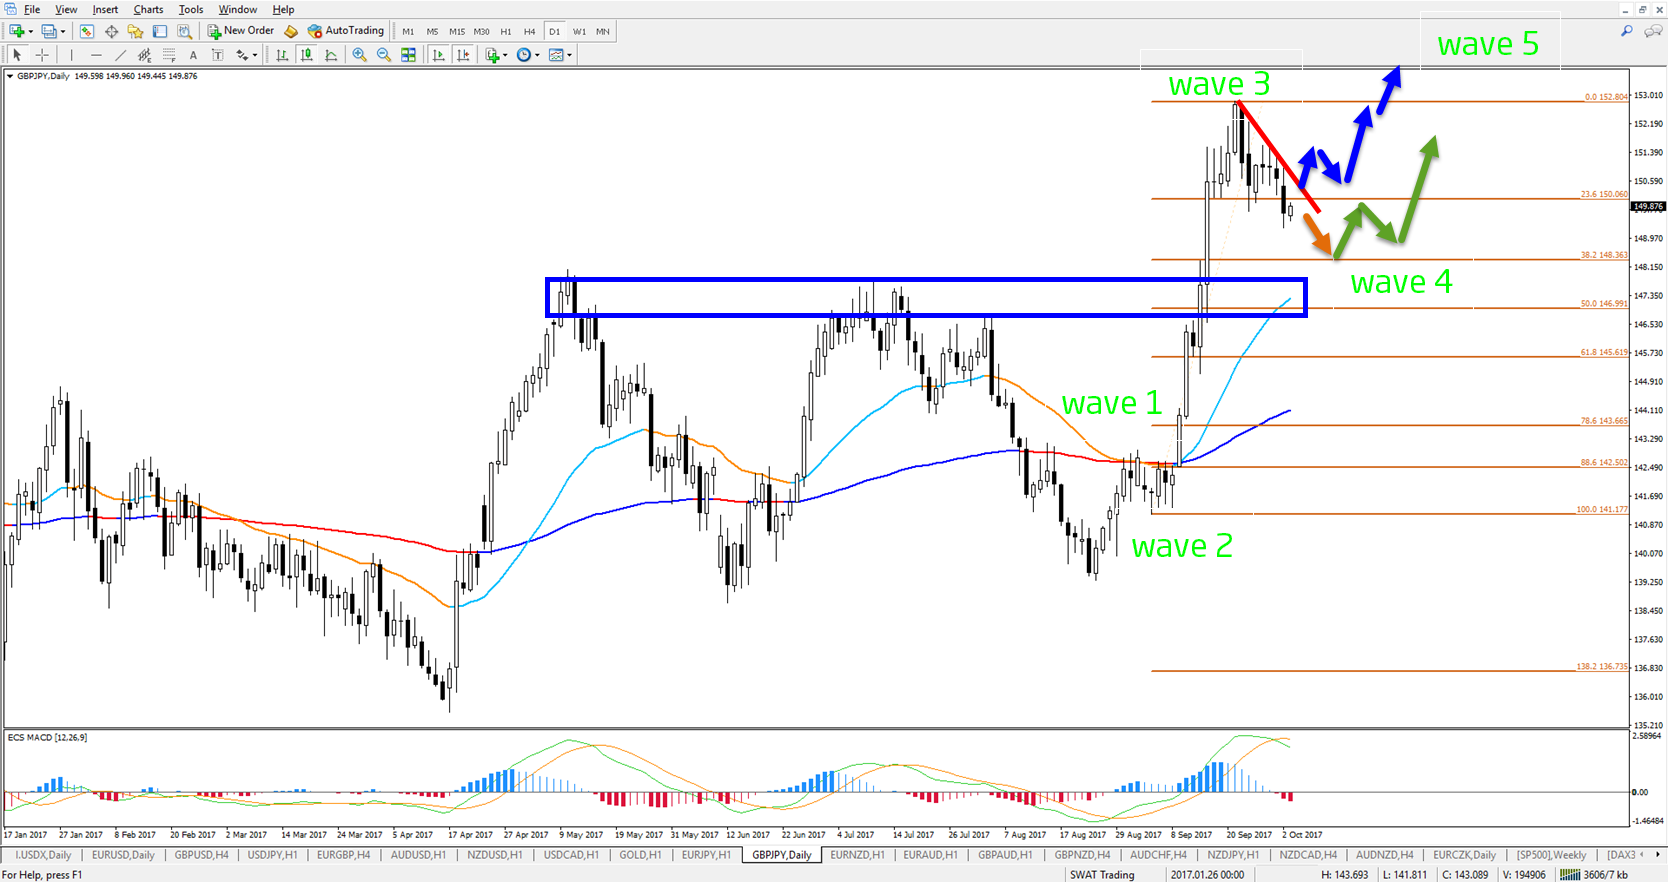
The GBP/JPY daily chart is showing a bearish retracement at the moment. This bearish correction is probably part of the larger uptrend, as mentioned above, as long as price:
- Breaks the top within the next 4-5 weeks and
- Stays above 50-61.8% Fibonacci support levels.
The current retracement is probably a wave 4 retracement (green box) of this chart or perhaps even a lower time frame. In any case, price is usually choppy and corrective when in a wave 4 and price does not retrace deeply.
Usually turning spots are the 23.6% and 38.2% Fibonacci levels, although a 50% Fib can occur once in awhile. Besides the Fib support, there are also broken tops that could act as potential extra support levels too (blue box).
There are two ways to trade this pullback and potential continuation in my view :
- Wait for bullish candlestick pattern on the daily chart at the 38.2% Fibonacci level (and 50%). Price is currently below the 23.6% Fib so I’m waiting for price to reach the next Fib. An extra confirmation of the bullish turn would happen when the ecs.MACD loses its thick red bar and becomes thin again.
- A bullish breakout, pullback, and continuation above the resistance trend line (red) on the 4 hour chart.
Wish you all good trading,
Chris
My twitter: @ChrisSvorcik
More info on our ecs.SWAT course and trading system
Elite CurrenSea Twitter: @EliteCurrenSea
Youtbe: Elite CurrenSea
.


Leave a Reply