? USD/JPY Bearish Breakout after Completing Wave E Triangle ?
December 7, 2018
2 min read
Subscribe
Hi traders,
The USD/JPY has broken below the support trend line (dotted blue) for the second time which seems to have ended the triangle chart pattern and indicate the start of a bearish breakout.
USD/JPY
4 hour
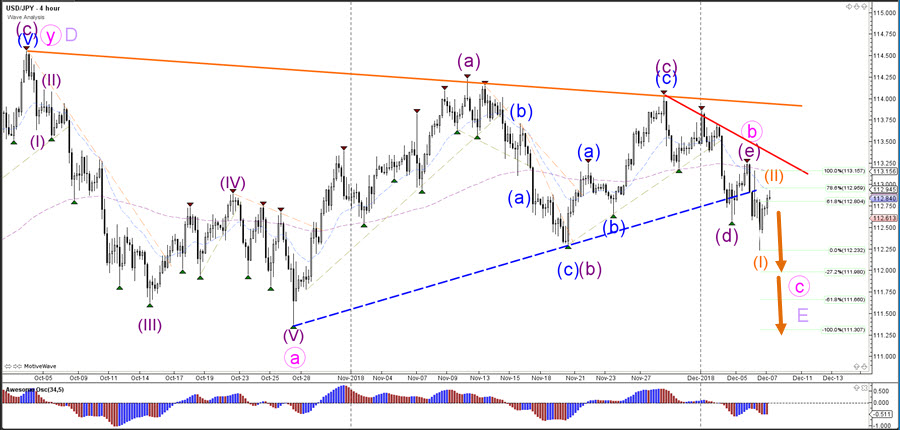
The USD/JPY seems to have completed a wave E (purple) of a wave B (pink), which could start a downtrend within the expected wave C (pink) of wave E (light purple).
1 hour
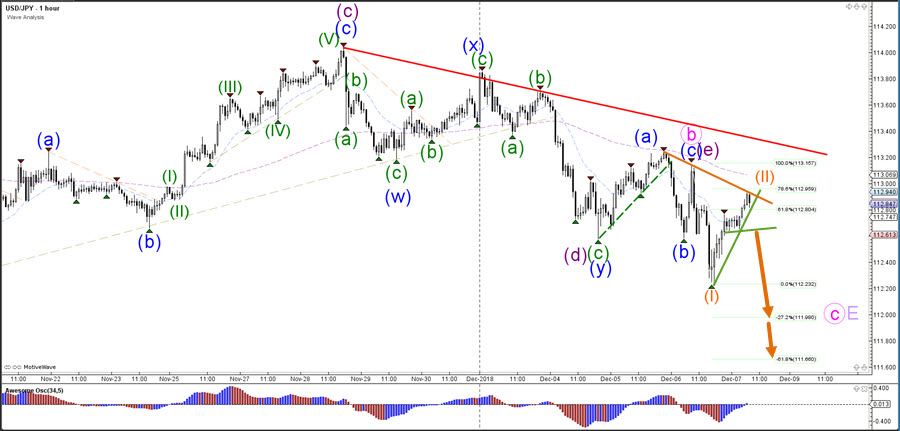
The USD/JPY is testing the 78.6% Fibonacci retracement level of wave 2 vs 1. A break above the 100% Fib invalidates the wave 1-2 (orange) pattern but a break below the support trend lines (green) could indicate a bearish breakout and continuation.
For more daily wave analysis and updates, sign-up up to our ecs.LIVE channel.
Good trading,
Chris Svorcik
Elite CurrenSea


Leave a Reply