? USD/JPY Bears Lose Control at 78.6% Fibonacci ?
Subscribe
Hi traders,
the USD/JPY made a bearish continuation after breaking below the support trend line (dotted blue) but the price has now reached a key reversal spot at the 78.6% Fibonacci support zone. Will the USD/JPY make a reversal or break the Fibs and confirm a downtrend?
USD/JPY
4 hour
The USD/JPY long-term direction could soon be decided. The breakout direction will be the decisive factor whether the price will enter into a long-term up or downtrend. For the moment, the current wave outlook is favoring the end of the wave 2 (pink) at the 78.6% Fibonacci retracement level after a bearish ABC (purple) pattern. A break above the resistance trend lines (red) could confirm that where a break below the 100% Fibonacci of wave 2 vs 1 invalidates this forecast.

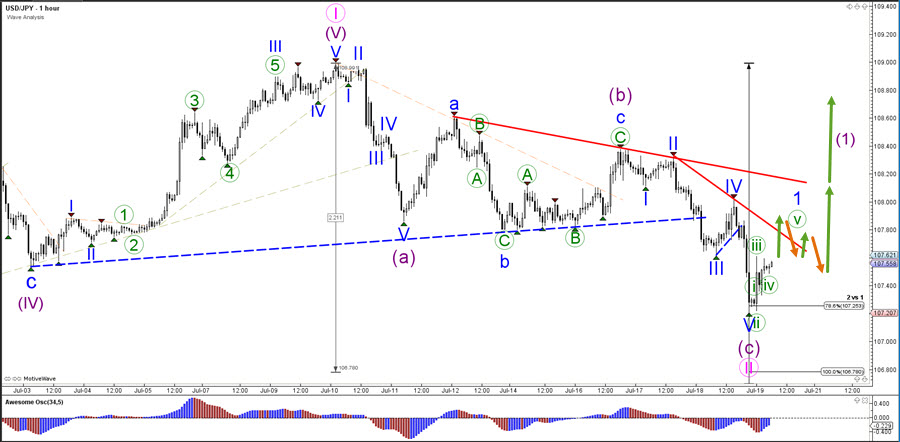
1 hour
The USD/JPY seems to have completed 5 bearish waves (blue) at the most recent low, which in turn could complete wave C (purple) of wave 2 (pink). Currently, price action seems to be confirming a first bullish impulse (green waves) within a wave 1 (blue). If the price does complete 5 bullish waves, then an ABC retracement is likely to take place as part of a bearish correction in a wave 2.
For more daily wave analysis and updates, sign-up up to our ecs.LIVE channel.
Good trading,
Chris Svorcik Elite CurrenSea


Leave a Reply