? USD/JPY Bull Flag Break Reaches Key 112.50 Resistance ?
September 19, 2018
2 min read
Subscribe
The USD/JPY bullish channel has reached a key 78.6% Fibonacci retracement level of wave X (pink), which is a critical decision zone for a bullish break or bearish bounce.
USD/JPY
4 hour
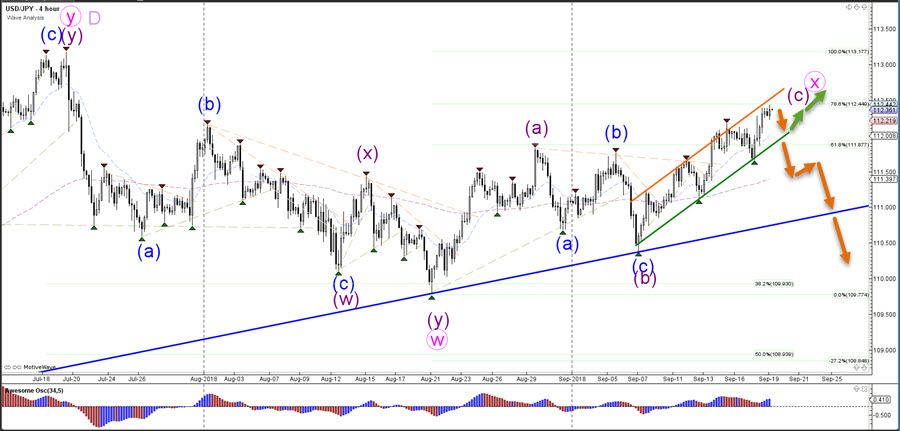
The USD/JPY will need to break below the support trend line (blue) of the bullish channel before a larger correction becomes more likely. A bullish continuation could see price move towards the next target zone around 112.75-113.
1 hour
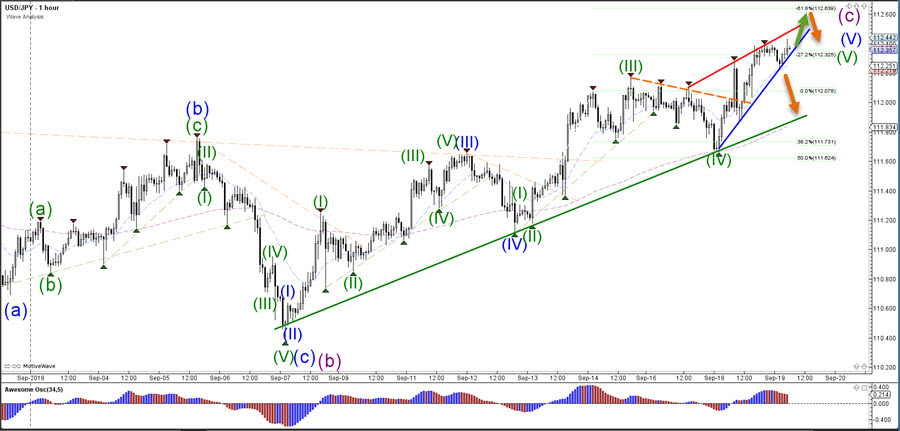
The USD/JPY broke above the bull flag chart pattern and has reached the -27.2% Fibonacci target. A continuation could see price move towards the -61.8% Fib target whereas a bearish breakout could price fall and challenge the support line (green).
Good trading,
Chris Svorcik
Elite CurrenSea


Leave a Reply