? USD/JPY Bullish Breakout Faces Heavy 110 Resistance Zone ?
Subscribe
Hi traders,
the USD/JPY made a bullish breakout above resistance (dotted orange), which could either start a continuation of the uptrend or be part of a larger ABC correction.
USD/JPY
4 hour
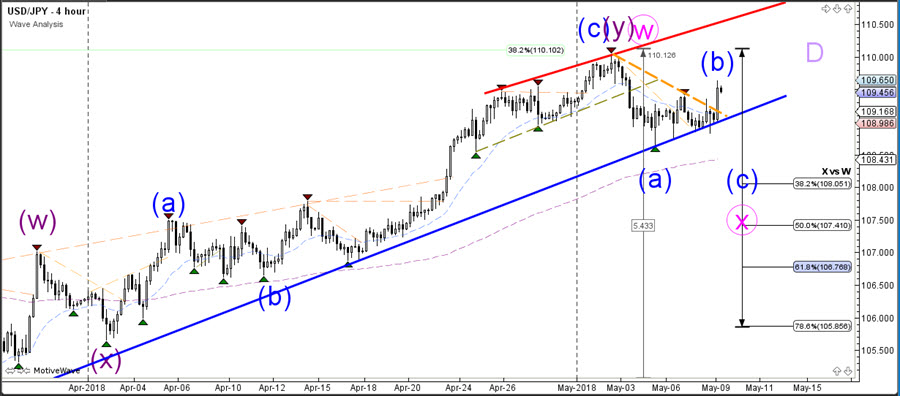
Price would need to break above the previous top at 110 to confirm the uptrend whereas a break below the support trend lines (blue) near 109 indicates that a larger bearish correction becomes more likely. A bullish breakout above the 110 resistance level could indicate an extension of the wave W (pink) towards the 50% Fib at 111.50 whereas a bearish break aim at 108-107.50.

1 hour
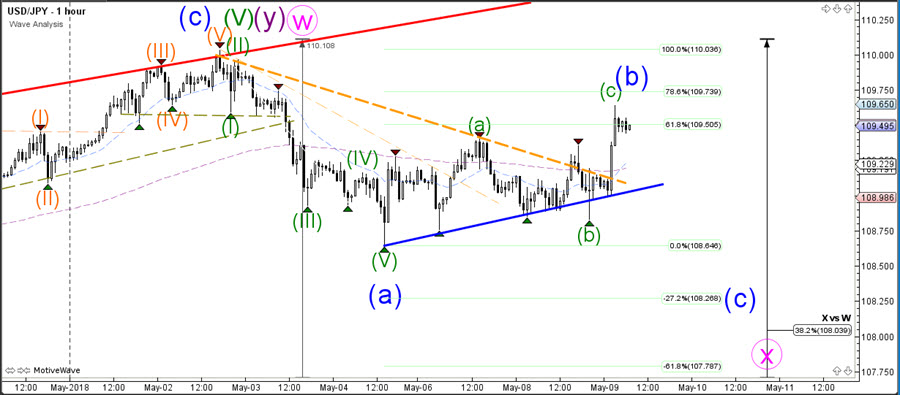
The USD/JPY is showing a bullish breakout but the Fibonacci levels could act as a potential resistance. Price could be building a larger ABC (blue) zigzag correction but a break above the 100% Fibonacci level and resistance zone at 110 invalidates this wave pattern. A break below the support trend line (blue) is needed before such an ABC becomes more likely.
Good trading,
Chris Svorcik
Elite CurrenSea
.


Leave a Reply