? USD/JPY Bullish Impulse Testing Deep Fibonacci Levels ?
Subscribe
Hi traders,
The USD/JPY is testing the Fibonacci retracement levels of potential wave B (pink), which is a key decision zone for a bounce or break.
USD/JPY
4 hour
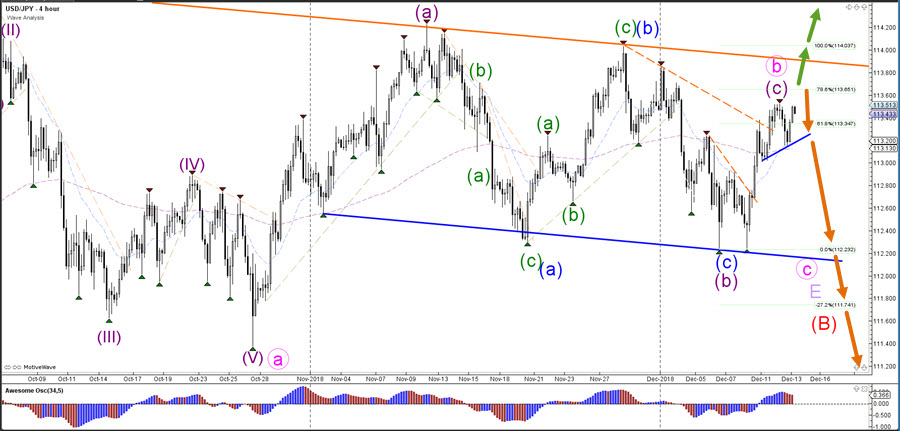
The USD/JPY is expected to make a bearish bounce and breakout if the wave patterns are correct. The wave B (pink) is possible as long as price stays below the 100% Fibonacci level at 114.03 whereas a break above this level would invalidate this wave pattern.
1 hour
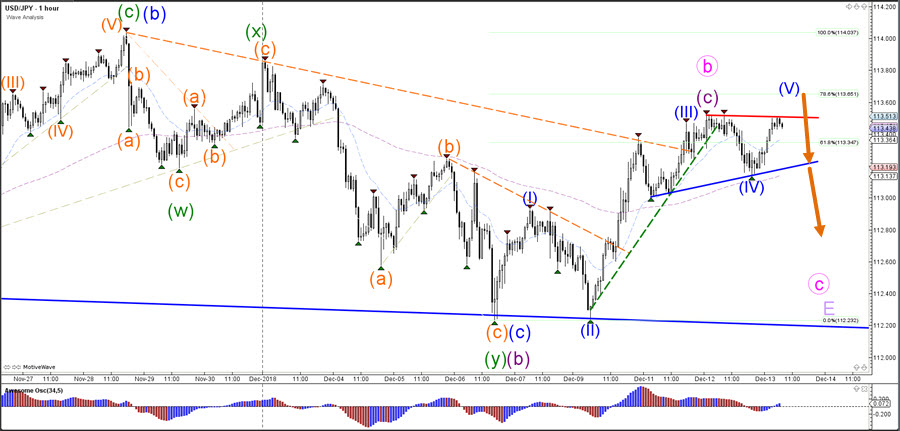
The USD/JPY offers key support (blue) and resistance (red) trend lines for a potential breakout. A bullish break could indicate a wave 5 (blue) and see price move towards the 78.6% Fibonacci level whereas a bearish break could see price start the wave C (pink).
For more daily wave analysis and updates, sign-up up to our ecs.LIVE channel.
Good trading,
Chris Svorcik
Elite CurrenSea


Leave a Reply