? USD/JPY Completes Wave 4 at 23.6% Fibonacci Resistance ?
Subscribe
Hi traders, the USD/JPY is moving sideways, which seems to confirm a corrective wave 4 (green) pattern. Price is expected to move lower again after bouncing at the Fibonacci levels of wave 4 vs 3 or after breaking below the support trend line.
USD/JPY
4 hour
The USD/JPY is probably building one more bearish swing in the wave 2 (purple) correction. Eventually price is expected to start an uptrend once the bearish waves Y (purple/pink) are completed. For the moment, price is expected to make at least one more lower as part of a wave A (blue) or C.

1 hour
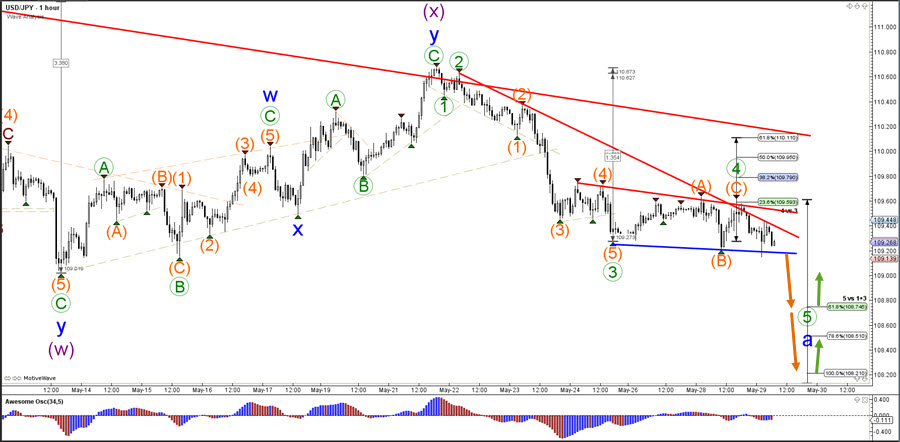
The USD/JPY seems to have completed a bullish ABC (orange) pattern within the wave 4 (green) correction at the 23.6% Fibonacci retracement level of wave 4 vs 3. Now a bearish breakout below the support trend line (blue) could take place but a failure of price break below it could indicate a deeper pullback to the 38.2% Fib. The main target are the Fibonacci levels of wave 5 vs 1+3.
For more daily wave analysis and updates, sign-up up to our ecs.LIVE channel.
Good trading,
Chris Svorcik Elite CurrenSea


Leave a Reply